Credit-Ready but Priced Out: Chicago’s Homeownership Affordability Gap by Neighborhood
Chicago renters overwhelmingly want to own homes, but credit barriers, limited savings, and a shortage of affordable housing often stand in the way.
By Necati Celik, Ph.D., Amber Jackson
-
Program:
-
Category:
-
Tags:
Key Takeaways
-
- Seventy percent of Chicago renters said they would prefer to own rather than rent, yet just 8.2% of renters became homeowners between 2022 and 2025.
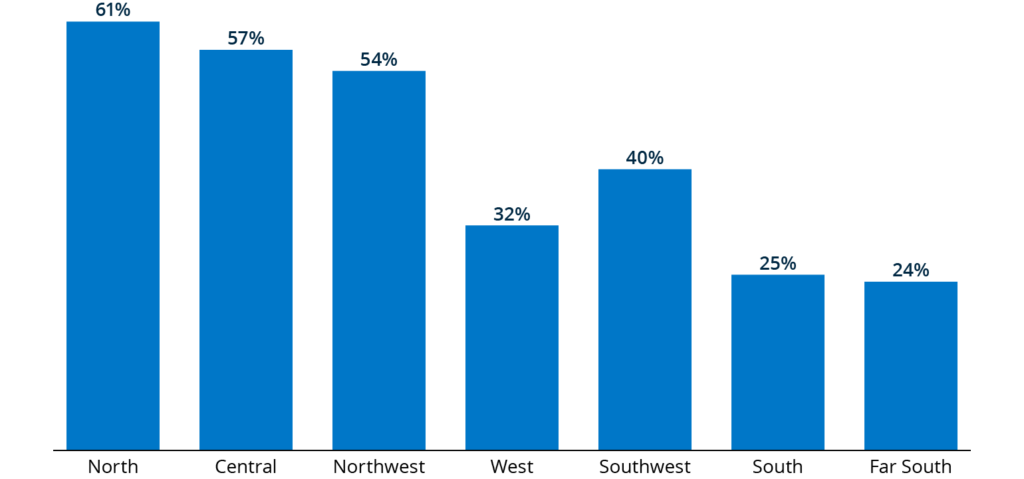
- In 2022, 61% of renters in North Chicago were credit-ready, compared with 24% in Far South Chicago. This 37-percentage-point gap means renters in some regions of the city were more likely to start the homebuying process with credit profiles that support mortgage approval.
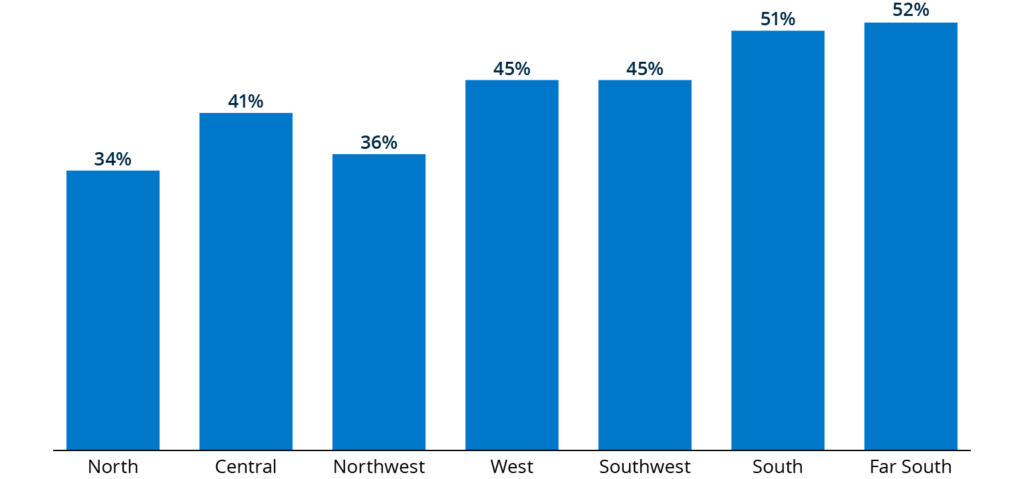
- By 2025, more than 40% of previously credit-ready renters with student loans were no longer ready for a mortgage application in every region except North and Northwest Chicago.
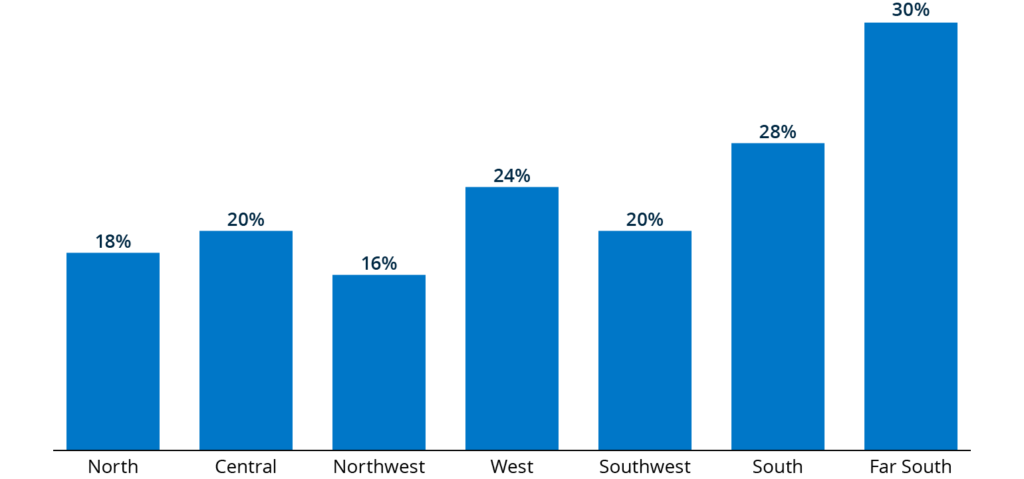
- Fewer than one-third of credit-ready renters in all of Chicago’s seven regions made a mortgage inquiry between 2022 and 2025, suggesting barriers to homeownership that extend beyond lack of credit readiness.
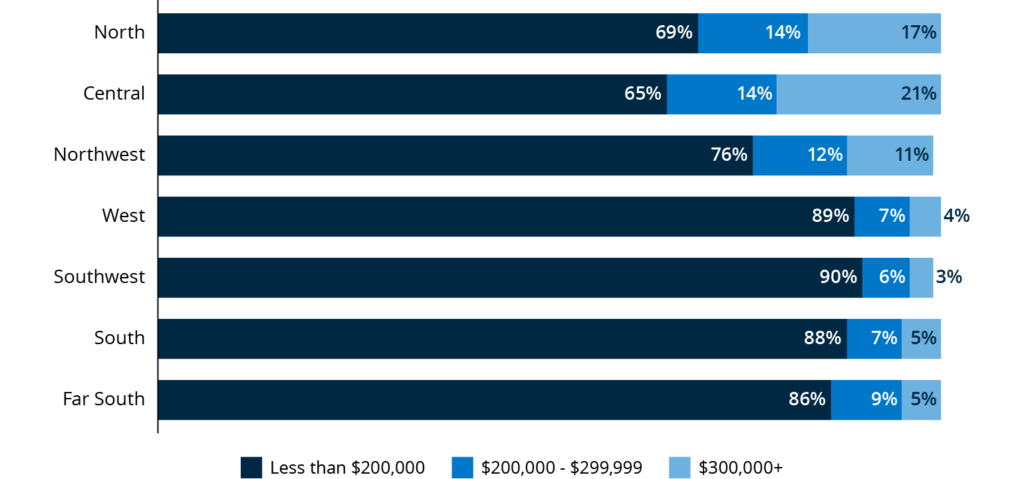
- Only about 1 in 10 credit-ready renters in South, West, Southwest, and Far South Chicago could afford a home priced over $200,000.
- Even when credit-ready renters do apply for mortgages, those in West, Southwest, South, and Far South Chicago were less likely to become homeowners.
- Renters from South and Far South Chicago were more likely to stay within the South Side communities, whereas renters from North, Central, Northwest, and West Chicago were more likely to purchase outside of Cook County as a whole.
The Affordability Gap in Chicago Homeownership
Homeownership is an important cornerstone of wealth-building in the United States. For half of U.S. households, equity in their homes makes up nearly half of their net worth.1 The positive outcomes associated with owning a home extend beyond individual wealth, enhancing community vitality and reaching across generations.2 In Chicago, however, the homeownership rate remains low, especially among young adults. In 2024, only about one-fifth (21%) of people younger than 35 owned the home they lived in, compared with 34% across all U.S. metropolitan areas.3
Yet the aspiration to own a home remains strong in Chicago. In our recent research, we found that more than two-thirds of renters would prefer to own a home rather than rent, but nearly three-quarters reported that buying a home would be difficult in 2025.4 Chicago renters faced a range of barriers to homeownership, including an inability to afford a down payment, a limited supply of affordable homes, insufficient income flow, high interest rates, low credit scores, excessive debt, and feeling intimidated by the homebuying process. In this brief, we focus on two of these obstacles: a lack of credit readiness and a limited stock of affordable homes in Chicago.
To better understand the role that credit readiness plays in a housing market where increasing home prices and high interest rates make it particularly challenging for first-time buyers to achieve their goals, this analysis draws on two main data sources: aggregated credit records from TransUnion and the Financial Health Pulse® 2025 Chicago Trends Report survey. These sources are supplemented by information on mortgage applications and originations collected under the Home Mortgage Disclosure Act (HMDA).
Together, these data allow us to examine not just who is financially ready for a mortgage loan, but who actually applied for one and achieved homeownership over the three-year period. In addition, we compare the housing budget (i.e., how much house renters could afford) of credit-ready renters with prevailing home values across Chicago to understand the housing affordability gap. Understanding how individual financial circumstances intersect with market conditions can help financial services companies, policymakers, and community organizations design more effective programs and supports, such as credit-building programs, down payment assistance, and an increased supply of affordable housing for sale across Chicago. All of these measures could help put homeownership within reach for renters who are ready and willing to own.
In this brief, we first explore what it means to be credit-ready, the share of credit-ready renters across seven regions of Chicago, and how student loans may have contributed to some renters losing their credit readiness. We then examine the share of renters across the city who applied for a mortgage and subsequently became homeowners. Next, we focus on credit-ready renters who can take on a mortgage and compare how much home they could afford to home prices across Chicago. Finally, we turn our attention to renters who became homeowners and show where in Chicago or outside of the city they purchased homes, potentially reflecting affordability gaps we observed across Chicago. The picture that emerges is one of deep and persistent inequity, not only in who can afford to buy, but also where and on what terms.
How Does Credit Readiness Relate to Homebuying in Chicago?
Credit readiness remains a significant barrier to homeownership for many renters. Only 8.2% of Chicago renters in our study became homeowners between 2022 and 2025. One of the key barriers many renters faced was not having good credit. Less than two-thirds (61%) of Chicago renters ages 25 to 64 reported having “good,” “very good,” or “excellent” credit scores in our Financial Health Pulse 2025 Chicago Trends Report survey. This share was even lower on the South and West sides of the city.5 These disparities closely align with regional differences in the percentage of renters who indicated that their credit was one reason it would be difficult to buy a home if they wanted to (Figure 1). However, renters have a tendency to overestimate the credit score needed for a mortgage application, so self-reported measures may not provide a complete picture of readiness.6
Figure 1. Barrier to homeownership: “My credit is not good enough.”
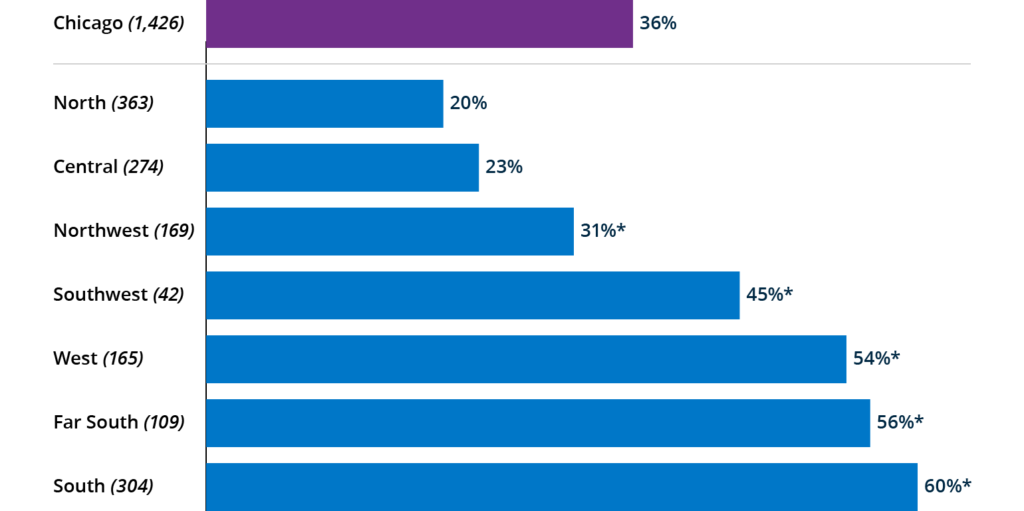
*Statistically significant differences relative to “North.”
Source: Financial Health Pulse 2025 Chicago Trends Report.
Notes: Renters ages 24 to 65. This question was only asked to respondents who were not homeowners and indicated it would be “very” or “somewhat” difficult if they wanted to buy a home today. Sample sizes are in parentheses. In response to the question, “What are the reasons it would be difficult to buy a home today? Please select all that apply.”
We define credit readiness by examining renters’ credit profiles from TransUnion, one of the major credit bureaus. Following Freddie Mac’s framework, our definition considers a renter credit-ready if they have:
-
- A prime or above credit score, defined as a VantageScore® of 661 or above
- Monthly debt payments that did not exceed 25% of before-tax income
- No recent record of payments that were 120 days or more past due
- No record of a bankruptcy in the past 7 years7
Since this definition has a stricter credit score threshold than the minimum required for conventional mortgages, this measure of mortgage readiness does not represent a hard barrier to applying for a mortgage, but rather an approximation of a higher chance of getting approved.8
The share of credit-ready renters in Chicago varied drastically across the city, ranging from 24% to 61%. In 2022, more than half of renters in North (61%), Central (57%), and Northwest (54%) Chicago were credit-ready, in stark contrast to only about one-quarter of renters in South (25%) and Far South (24%). Renters in Southwest (40%) and West (32%) Chicago fell in between, but still trailed behind renters in the Northern regions.
Figure 2. Percentage of renters who were credit-ready in 2022 across Chicago.
Source: TransUnion Consumer Credit Data.
How Did Student Loans Impact Credit Readiness for Renters in Chicago?
Falling behind on student loans might have disrupted credit readiness for some Chicago renters. At the onset of the COVID-19 pandemic in March 2020, the federal government paused payments and interest on most federally held student loans. That pause lasted for over three years, ending in October 2023 with the start of a 12-month on-ramp period for borrowers. As payments resumed, student loan delinquencies increased sharply.9
To understand whether this increase in student loan delinquency harmed credit readiness, we looked specifically at renters who were credit-ready and had an open student loan in 2022. By June 2025, over 40% of credit-ready renters in Chicago with student loans had lost their credit readiness in every region except North and Northwest. This share exceeded the 34% of all credit-ready Chicago renters in our study group who were no longer credit-ready in 2025, especially for renters in West, Southwest, South, and Far South Chicago.
These results point to a potential association—although not direct causality—between severe student loan delinquency and the loss of credit readiness. It is plausible that people who experienced student loan delinquency were also likely to struggle with other debt obligations, putting pressure on their finances more generally and having a compounding effect on credit readiness.
Figure 3. Percentage of renters with student loans who lost credit readiness.
Source: TransUnion Consumer Credit Data
Notes: Among renters who were credit-ready as of June 30, 2022, and had an open student loan between June 30, 2022, and June 30, 2025.
Key Takeaway: Credit readiness varies sharply across Chicago and may prevent renters from pursuing homeownership.
Renters in South and Far South Chicago were less than half as likely to be credit-ready as renters in North Chicago. Renters who carried student loan debt were at especially high risk of losing their credit readiness. Among renters who were credit-ready and had student loans in 2022, more than 40% lost their credit readiness across all regions except North and Northwest Chicago. Investing in community organizations that help aspiring homeowners manage debt and repair their credit, as well as expanding access to and use of rent reporting to establish and build credit, are two strategies local stakeholders should consider.
Most Chicago Renters Prefer to Own, But A Much Lower Share Applied for a Mortgage
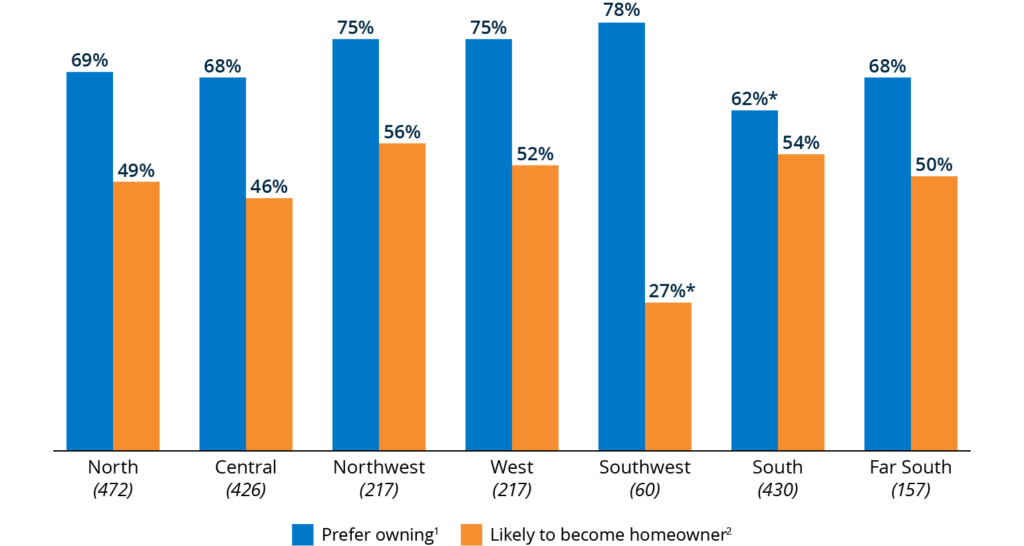
There is no direct correlation between credit readiness and a renter’s desire to become a homeowner. Across Chicago, 70% of renters ages 25 to 64 said they would prefer to own instead of rent, with very small variation across different regions of the city. Similarly, half of renters in Chicago (51%) reported that they were likely to become homeowners within the next five years. With the exception of Southwest Chicago, renters in regions across the city were equally optimistic about becoming homeowners.
Figure 4. Percentage of renters who want to own and expect to become homeowners.
*Statistically significant difference relative to “North”
Source: Financial Health Pulse 2025 Chicago Survey.
Note: Among renters who are 25 to 64 years old.
1 In response to the question: “Assuming you had the financial resources to do so, would you like to own instead of rent your primary residence?” (Yes, would prefer owning). Sample sizes are in parentheses.
2 In response to the question: “In the next 5 years, how likely are you to become a homeowner?” (Very likely/Somewhat likely). This question was asked only to those who prefer owning or don’t have a preference between owning or renting.
Desire to become a homeowner may not always translate to taking the necessary steps to achieve it. One of the most important steps to take on the path to homeownership is submitting a mortgage application, which appears as a mortgage inquiry on a consumer’s credit profile.
In Chicago, the percentage of credit-ready renters who made mortgage inquiries during our study period was much lower than the percentage of renters who said they would prefer owning or thought they were likely to become homeowners in the next five years. Although the share of renters with mortgage inquiries was higher in Far South and South, less than a third of credit-ready renters in these regions applied for a mortgage. One possible explanation for the low rate of mortgage applications among credit-ready renters in the Far South and South regions of Chicago could be lack of funds for a down payment, which was not factored into our definition of credit readiness. Previous Financial Health Network research found that insufficient down payment funds were the leading reason renters said they found it difficult to buy a home in Chicago.10 Similarly, closing costs for a mortgage loan may also be a barrier to entry for many renters in Chicago.11
Figure 5. Percentage of credit-ready renters who made a mortgage inquiry.
Source: TransUnion Consumer Credit Data
Key Takeaway: Insufficient funds for a down payment may put homeownership out of reach.
Less than a third of credit-ready renters in Chicago made a mortgage inquiry, suggesting that lack of credit readiness is not the only barrier renters face on their path to homeownership. Lack of sufficient funds for a down payment is another significant barrier that may be holding back credit-ready renters from a mortgage application. In the Financial Health Pulse 2025 Chicago Trends Report, 65% of renters in Chicago reported less than $8,000 in their checking or savings accounts.12 There are various channels to help renters build resources for a down payment. Higher wages, access to employer-sponsored savings programs, and employer-sponsored first-time homebuying assistance when offered as workplace benefits can help aspiring homebuyers. Direct down payment assistance government programs are also an effective way to address this need.
What Happens After a Credit-Ready Renter Applies for a Mortgage in Chicago?
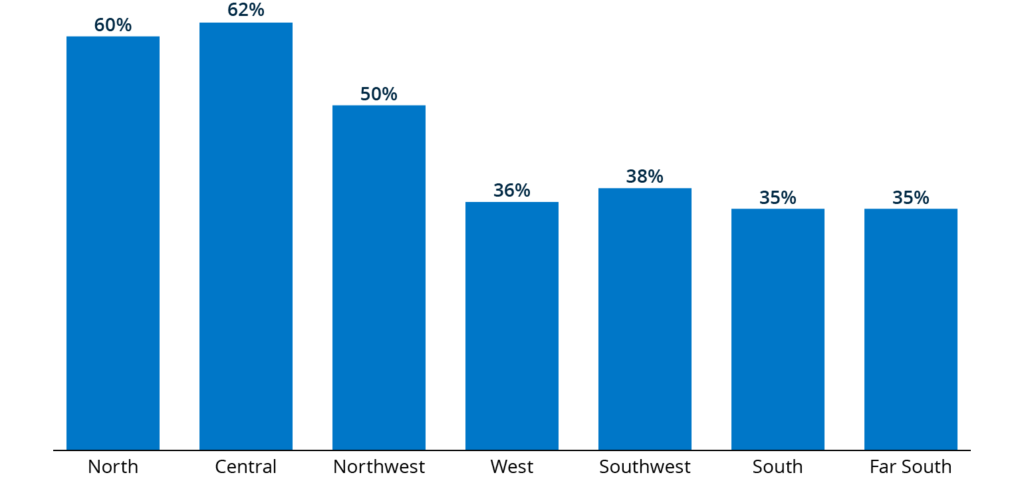
Once a mortgage inquiry was made, renters in Central (62%) and North (60%) Chicago were much more likely to become homeowners between 2022 and 2025. In contrast, only 35% of credit-ready renters in Far South and South Chicago who inquired about a mortgage ultimately became homeowners. West (36%) and Southwest (38%) Chicago showed similarly low transition rates.
Figure 6. Percentage of credit-ready renters who became homeowners after a mortgage inquiry.
Source: TransUnion Consumer Credit Data
Note: Among those who had a mortgage inquiry between June 30, 2022, and June 30, 2025. For those who had an inquiry within the last 180 days of our study period, we extended the search for homeownership to cover the 180 days following the inquiry.
Home Mortgage Disclosure Act (HMDA) data show a similar geographical pattern.13 Mortgage denial rates were substantially higher in the South (14%), Southwest (10%), Far South (14%), and West (14%) Chicago than in North (5%), Central (6%), and Northwest (6%) Chicago.14
These findings suggest that barriers persist even after credit-ready renters begin actively pursuing a mortgage. A lack of funds for a down payment may hold back some renters from applying. Once a mortgage application has been submitted, however, insufficient down payment funds account for less than 10% of denials.15
Chicago’s housing market has also been impacted by decades of redlining and discriminatory lending practices that restricted access to credit and homeownership in many South and West Side communities.16,17 Although these practices were outlawed decades ago, research shows their effects still influence neighborhood wealth, housing values, homeownership rates, and access to credit.18 Even today, discrimination in mortgage lending may be another barrier faced by renters in certain parts of Chicago.19 As a result, differences in mortgage outcomes across Chicago neighborhoods may reflect not only current financial circumstances, but also the lasting effects of historical disinvestment.
Finally, there are many demographic factors associated with renting or owning a home.20 For example, some of the differences in homeownership rates across Chicago regions might be due to differences in age. However, even when comparing renter-to-owner transition rates among renters in the same age group (25 to 34 years old) who had prime credit scores (660 or higher), we still observed lower transition rates in West (18%), South (15%), and Far South (21%) Chicago than North (25%), Northwest (27%), and Central (31%) regions. These findings suggest that the disparities in transition rates across Chicago cannot be explained by differences in age and having good credit alone.
How Common Were FHA Loans in Chicago?
Federal Housing Administration (FHA) loans were more common in South and West Chicago. Designed to expand access to homeownership for borrowers with smaller down payments or lower credit scores, FHA loans were particularly relevant in neighborhoods with lower affordability and weaker credit profiles.
For renters who became homeowners, FHA loan originations were the most frequent in Far South (45%) and South (43%) Chicago, where nearly half of all homebuyers rely on FHA financing, compared to just 7% in Central and North Chicago. Southwest (33%) and West (36%) Chicago fell in between, with roughly one-third of buyers financing their homes through FHA loans.
Table 1. Types of mortgage loans originated by credit-ready renters who became homeowners across Chicago.
| Type of mortgage | North | Central | North west |
West | South west |
South | Far South |
| FHA | 7% | 7% | 15% | 36% | 33% | 43% | 45% |
| VA | 2% | 2% | 3% | 4% | 3% | 5% | 5% |
| Other* | 91% | 91% | 83% | 60% | 64% | 52% | 50% |
Source: TransUnion Consumer Credit Data
*Most of these loans are conventional loans; however, a small percentage includes USDA loans and special programs.
FHA loans offer many advantages for first-time Chicago homebuyers. Because the minimum credit score requirement is much lower than conventional loans, a borrower with a credit score as low as 500 may qualify with a 10% down payment.21 FHA loans also do not have risk-based pricing, meaning that all borrowers receive the same interest rate, regardless of their credit score.22
However, FHA loans usually carry higher costs, such as the upfront mortgage insurance premium. Although these costs can be rolled into the loan, they often increase the monthly payments relative to a conventional loan.23 FHA loans also have permanent mortgage insurance payments that require borrowers to pay an additional monthly amount for the entire loan term, which differs from a conventional loan that waives the mortgage insurance once the loan balance comes down to 80% of the home value.24 Having permanent private mortgage insurance (PMI) impacts borrowers’ debt-to-income (DTI) ratio and can significantly reduce borrowing power. This can push borrowers out of the qualifying range for homes in their desired market, limiting neighborhood choice and widening the housing affordability gap.
FHA borrowers can save on monthly housing costs by refinancing their loans to a conventional loan once their loan-to-value ratio falls to 80%. However, recent research shows that a large share of FHA borrowers refinance their loans to another FHA loan, missing out on these potential savings.25
Key Takeaway: Credit readiness does not lead to equal mortgage outcomes across Chicago.
Credit-ready renters in South and West Chicago were less likely to become homeowners after a mortgage inquiry than credit-ready renters in Central and North Chicago. Among credit-ready renters who did become homeowners, buyers in South and West Chicago were also more likely to use FHA financing. Higher mortgage denial rates in these regions suggest that barriers persist even after credit-ready renters enter the mortgage process. While these disparities can’t be attributed to one single cause, they exist within a housing market still shaped by the lingering impact of redlining, discriminatory lending, and historical disinvestment.
How Much Are Renters Spending on Homes in South and West Chicago?
Credit readiness is only half of the journey for renters who want to become homeowners. The other half is about affordability.
Most credit-ready renters in South and West Chicago have limited homebuying budgets, and in many Chicago neighborhoods, the prices of available homes were far above what many credit-ready renters could afford. Across Chicago, less than two-thirds of credit-ready renters could afford a house priced above $200,000 in 2025. In South (12%), West (11%), Southwest (9%), and Far South (14%) Chicago, only about 1 in 10 credit-ready renters could afford homes priced above $200,000. By comparison, credit-ready renters in Northwest (23%), Central (35%), and North (31%) Chicago were much more likely to afford homes above $200,000.
The median value of homes purchased by buyers ages 25 to 44 years old in 2024 was $495,000 in North Chicago and $465,000 in Central Chicago, compared with $255,000 in Far South and $285,000 in South Chicago.26 Even in lower-cost neighborhoods, median home values were still higher than what most credit-ready renters could afford. For example, nearly 9 in 10 credit-ready renters in Far South and South Chicago could not afford a median home in the Auburn Gresham-Morgan Park neighborhood, where the median sales price was $250,000. An even larger gap separated renters’ budgets from the Bronzeville-Hyde Park area, where the median sales price was $510,000.27
Figure 7. The maximum home value credit-ready renters could afford across Chicago in 2025.
Source: TransUnion Consumer Credit Data
Note: For Chicago renters who were credit-ready at the end of the study period (June 30, 2025).
How Did We Calculate Purchase Budgets for Chicago Renters?
How much house a credit-ready renter can afford depends on several important factors.
-
- Down payment: The amount of a down payment determines the size of the mortgage principal. We assumed a 10% down payment, which is in line with the median down payment for first-time homebuyers.28 A down payment of less than 20% meant we also had to add private mortgage insurance (PMI) in our calculations, which we assumed to be 14% of the total monthly mortgage payments.
- Interest rate and mortgage term: The mortgage interest rate and the mortgage term determine the size of monthly payments. We assumed a 6% interest rate for a 30-year mortgage. Making an assumption on the interest rate is particularly tricky since it is highly dependent on a borrower’s credit score for conventional loans.
- Debt-to-income (DTI) ratio: A borrower’s DTI ratio helps determine the maximum monthly payment a borrower may qualify for based on their income and other debt obligations, often using the 28/36 DTI rule.29 We used the individual income of each borrower. This is a limitation of our approach, as most first-time homebuyers combine income with a joint borrower. For simplicity, this analysis assumes a maximum back-end DTI ratio of 36%. In practice, underwriting standards are more flexible. Fannie Mae, for instance, allows underwriting up to 45% DTI for highly qualified borrowers.30
- Taxes and insurance: Our analysis used the median property tax bill in Chicago ($4,454 for the 2024 tax year) and assumed $185 per month for homeowners’ insurance.31,32 Any assumption on homeowners’ insurance will carry a large degree of error due to the volatility of insurance costs across Illinois in recent years.33
We first calculated the maximum amount of monthly housing payments per the 28/36 DTI rule; existing monthly debt liabilities as observed on credit records; and assumptions on taxes, insurance, and PMI payments. We then used the assumptions on APR and down payment to calculate the maximum house value one can afford based on their maximum monthly housing payment.
Key Takeaway: Building a pipeline of affordable housing stock is key to supporting homeownership.
There is a large gap between what Chicago renters can afford and what housing options are available. Most credit-ready renters had estimated homebuying budgets below $200,000 in 2025, and in South, West, Southwest, and Far South Chicago, only 1 in 10 could afford a home priced above that threshold. By leveraging community land trusts and directing subsidies toward affordable homeownership developments, the city can secure a sustainable pipeline of housing stock. Additionally, robust policy protections are essential to prevent the erosion of current affordable units through luxury conversions in rapidly appreciating neighborhoods.
Where Did Renters End Up Buying in Chicago?
Patterns of mobility among new homebuyers’ purchased homes revealed another dimension of inequity in Chicago’s housing market. For renters in South and Far South Chicago, the most common homebuying destinations were within the South Side itself. Buyers frequently remained in their own region or moved between South and Far South neighborhoods, with roughly one-third purchasing homes in the same region where they had rented. Renters on the South Side were also the least likely to leave Chicago altogether, with only about one-third purchasing homes elsewhere in the city or in the suburbs.
Renters in West and Southwest Chicago were a bit more geographically mobile. About 21% of renters in the West and 36% of renters in the Southwest purchased a home in either of those regions. Renters in the West moved outside of Cook County at the highest rate (40%), which could indicate that renters in this part of Chicago were priced out of their neighborhoods, leading them to leave both the city and its surrounding suburbs.
In contrast to South and Far South, buyers from North (36%), Northwest (34%), and Central (34%) Chicago were much more likely to leave the city. When purchases in suburban Cook County are included, roughly half of buyers from Northwest (51%) and North (50%) left the city.
Figure 8. Where did Chicago renters purchase their first home?
Source: TransUnion Consumer Credit Data
Note: For Chicago renters who became homeowners by the end of the study period (June 30, 2025)
Source: TransUnion Consumer Credit Data
Note: For Chicago renters who became homeowners by the end of the study period (June 30, 2025)
Source: TransUnion Consumer Credit Data
Note: For Chicago renters who became homeowners by the end of the study period (June 30, 2025)
Source: TransUnion Consumer Credit Data
Note: For Chicago renters who became homeowners by the end of the study period (June 30, 2025)
Source: TransUnion Consumer Credit Data
Note: For Chicago renters who became homeowners by the end of the study period (June 30, 2025)
Source: TransUnion Consumer Credit Data
Note: For Chicago renters who became homeowners by the end of the study period (June 30, 2025)
Source: TransUnion Consumer Credit Data
Note: For Chicago renters who became homeowners by the end of the study period (June 30, 2025)
These mobility patterns suggest that affordability constraints are not limited to South and West Chicago and affect renters throughout the city. Although a higher share of renters in these regions could afford higher-priced homes, median home values in North, Central, and Northwest Chicago still exceeded what was affordable to them. This mismatch may partially explain, among other noneconomic factors such as schools or safety, why a substantial share of buyers from these areas ultimately purchased homes outside the city or county.
Together, these patterns show that first-time homebuyers across Chicago do not enter the housing market with equal levels of flexibility or choice. Differences in affordability and purchasing power shape not only whether people can buy homes, but also where they can realistically move across the city. It’s worth acknowledging that renters who stay close to their community when they purchase a home may do so for personal reasons, such as community/family ties, life-stage changes, or having kids. Through this lens, these transitions can be considered positive outcomes from a community-building perspective. Despite potential positive implications, disparities in homebuying budgets across Chicago neighborhoods may also perpetuate geographic segregation by limiting many renters in South and West Chicago to purchasing homes in the same neighborhoods where they currently live.
Key Takeaway: Housing affordability and purchasing power shape where Chicago renters can become homeowners.
Renters from South and Far South Chicago were more likely to purchase within South Side regions, while buyers from North, Central, Northwest, and West Chicago were more likely to leave the city or county. These patterns may reflect differences in home prices and purchasing power, as well as family ties, neighborhood preferences, and other personal considerations. Taken together, the findings show that first-time homebuyers across Chicago do not enter the market with the same degree of choice.
Three Areas of Action to Drive Homeownership in Chicago
The evidence presented in this brief highlights a sobering reality: Even among renters who are credit-ready, homeownership is often out of reach. While the desire for homeownership remains strong across Chicago, the pathway to achieving it is increasingly divided by both geography and socioeconomic factors. Renters across different parts of the city don’t enter the housing market with equal access to credit, savings, affordable homes, or neighborhood choices.
Our findings highlight three barriers that stand in the way of achieving homeownership for Chicago renters:
-
- Credit readiness: Lack of credit readiness prevents many renters from moving toward homeownership. Renters who carry student loan debt are at especially high risk of losing credit readiness if they fall behind on payments. Local stakeholders can invest in community organizations that help aspiring homeowners manage debt and repair their credit. Expanding access to and use of rent reporting can also help renters establish and build credit.
- Down payments: Only a low percentage of credit-ready renters in Chicago applied for a mortgage. One reason for this may be that credit-ready renters still lack the cash needed to afford a down payment and closing costs. For a $250,000 property, the minimum down payment for an FHA loan is $8,750, or 3.5%. In the Financial Health Pulse 2025 Chicago survey, 65% of renters in Chicago reported having less than $8,000 in their checking or savings accounts. How can local stakeholders help renters build resources for a down payment? Higher wages, access to employer-sponsored savings programs, and employer-sponsored first-time homebuying assistance can help aspiring homebuyers accumulate savings. Public down payment assistance programs are also an effective way to address this cash flow barrier.
- Affordable housing supply: There is a large affordability gap between what Chicago renters can afford and what housing options are available. The city and relevant partners could leverage community land trusts and subsidies for affordable homeownership developments to create and secure a sustainable pipeline of affordable housing stock. Strong policy protections are also essential to preventing the loss of existing affordable units through luxury conversions in rapidly appreciating neighborhoods.
Chicago’s homeownership gap by neighborhood cannot be explained by any one factor. Credit readiness, savings, mortgage outcomes, home prices, and historical disinvestment are all interacting forces that shape whether renters can buy and where they can live.
Ultimately, reducing Chicago’s homeownership affordability gap will require more than helping individual renters qualify for mortgages. It will require coordinated action from financial services companies, policymakers, and community organizations to expand access to credit-building support, down payment assistance, and homes that first-time homebuyers can reasonably afford. These investments will not only put equitable homeownership within reach for renters who are ready and willing to purchase, but also help strengthen neighborhood stability and long-term financial health outcomes.
Methodology
TransUnion researchers identified all credit-active Chicago residents who were 25 to 64 years old, had no history of real estate credit (such as a mortgage or home equity loan) in their credit records, and did not have a deed associated with their name for the property at their address as of June 30, 2022. Throughout the brief, we refer to this group as “renters.” Homeownership outcomes for these renters were observed after a three-year period, as of June 30, 2025.
We developed custom measures that TransUnion aggregated across seven regions of Chicago based on where renters lived in 2022. These regions represent unique socioeconomic clusters of Chicago community areas, where both the demographic composition and financial health of households differ significantly. The North, Northwest, and Central regions of Chicago have a much higher concentration of Financially Healthy, high-income, college-educated, and white households than the other regions.34
It is important to note that the study period coincided with a unique housing market for homeowners in the U.S. At the start of 2022, the Federal Reserve began the first of many interest rate adjustments to curb inflationary pressures on the economy. By the end of the year, the average rate on a 30-year mortgage in the U.S. had already risen from 3% to 7% and has not fallen below 6% since. The last time mortgage rates were this high was during the housing market bubble in the lead-up to the 2008 recession.35
At the same time, home prices increased at a much faster rate than usual both in Chicago and across the rest of the U.S.36 While this increase cooled off somewhat by 2023, Chicago home prices continued to rise at a higher rate than their pre-pandemic pace, compounding the affordability challenges experienced by many Chicagoans.37 This meant prospective homeowners in Chicago faced both a very expensive housing market and a steep cost of borrowing during our study period, resulting in slower sales activity in Chicago.38 Therefore, we expect the renter-to-homeowner transition rate in this period to be lower than usual.
Frequently Asked Questions
Why can't more renters afford homes in Chicago?
Many Chicago renters face several compounding barriers to homeownership, including limited savings, debt obligations, credit challenges, high mortgage rates, and a shortage of homes within their purchasing budgets. Even renters who qualify for a mortgage often can’t afford what’s available. In South, West, Southwest, and Far South Chicago, only about 1 in 10 credit-ready renters could afford a home priced above $200,000 in 2025.
What credit score do you need to buy a house in Chicago?
In this analysis, we define credit-ready renters by having a VantageScore of at least 661, manageable monthly debt payments, no recent payments that were 120 days or more past due, and no bankruptcy during the past seven years. However, it is worth noting that conventional mortgages often accept lower scores than that threshold.
Does student loan debt affect a renter’s ability to purchase a home?
Student loan debt can impact mortgage readiness by increasing monthly debt obligations or harming a borrower’s credit if payments become delinquent. In our study, more than 40% of credit-ready renters with student loans lost their credit readiness by 2025 in every region except North and Northwest Chicago. While this finding coincided with the resumption of federal student loan payments, our analysis does not establish that student loans directly caused the loss.
Where in Chicago could credit-ready renters afford to purchase?
Credit-ready renters in North, Central, and Northwest Chicago were the most likely to afford a home priced above $200,000 in 2025. However, median home values in those regions were also higher. Renters in South, West, Southwest, and Far South Chicago had the lowest purchasing budgets, with even relatively lower-priced homes often remaining out of reach.
Acknowledgments
This research received financial support from The Chicago Community Trust. We thank Tracie Anderson and Greg Schlichter at TransUnion for their partnership and continued support of this work. We also thank David Silberman and Andrew Warren at the Financial Health Network, Michael Neal at the Urban Institute, and Geoff Smith at the Institute for Housing Studies at DePaul University for their expert feedback.
- In the last quarter of 2025, the bottom 50% of the wealth distribution held 47% of their wealth in real estate. Source: “DFA: Distributional Financial Accounts,” Federal Reserve System, June 2026.
- “Research series: Outcomes associated with homeownership,” Habitat for Humanity, accessed July 2026.
- “Tenure by Age of Householder, American Community Survey 1-Year Estimates Subject Tables, Table B25007,” U.S. Census Bureau, 2024.
- Necati Celik, Amber Jackson, & Taylor C. Nelms, “Financial Health Pulse® 2025 Chicago Trends Report,” Financial Health Network, January 2026.
- South (36%, N = 441), West (38%, N = 222), Far South (28%, N = 161), Southwest (37%, N = 63).
- “Fannie Mae Mortgage Understanding Study: 2023 Refresh,” Fannie Mae, 2023.
- “Am I Financially Prepared to Take Out a Home Loan?,” My Home by Freddie Mac, January 2026.
- “B3-5.1-01, General Requirements for Credit Scores,” Fannie Mae, June 2026.
- Zara Jacob et. al., “Federal Student Loan Defaults Return After Pandemic Pause,” Federal Reserve Bank of New York, May 2026.
- Necati Celik, Amber Jackson, & Taylor C. Nelms, “Financial Health Pulse® 2025 Chicago Trends Report,” Financial Health Network, January 2026.
- Nuno Mota & Mark Palim, “Barriers to Entry: Closing Costs for First-Time and Low-Income Homebuyers,” Fannie Mae, December 2021.
- Necati Celik, Amber Jackson, & Taylor C. Nelms, “Financial Health Pulse® 2025 Chicago Trends Report,” Financial Health Network, January 2026.
- “Mortgage data (HMDA),” Consumer Financial Protection Bureau (CFPB), accessed July 2026. HMDA data shows the outcome of mortgage applications made across Chicago, which is different from the TransUnion data that shows the result of mortgage inquiries based on the location where the renters live. In addition, HMDA denial rates include applicants who might not be “credit-ready” or first-time buyers. Although they don’t measure the same thing, both HMDA and TransUnion findings point to similar geographic disparities for homebuyers across Chicago.
- “HMDA Dataset Filtering,” Home Mortgage Disclosure Act, accessed July 2026. Own analysis of the 2024 HMDA dataset for ages 25 to 64. Denial rate is calculated as the number of actions_taken = 3 divided by the number of actions_taken = 1, 2, 3, 4, 5 for the purchase of a home, excluding refinance loans.
- Laird Nossuli, “2025 HMDA Data Findings Part 1: Mortgage Originations, Applications, and Trends,” iEmergent, April 2026.
- Daniel Aaronson, Daniel Hartley, & Bhash Mazumder, “The Effects of the 1930s HOLC “Redlining” Maps,” Federal Reserve Bank of Chicago, August 2020.
- “Mapping Inequality: Chicago,” Mapping Inequality, accessed July 2026.
- Bruce C. Mitchell et al., “Decades of Disinvestment: Historic Redlining And Mortgage Lending Since 1981,” National Community Reinvestment Coalition, May 2024.
- Linda Lutton, Andrew Fan, & Alden Loury, “ Where Banks Don’t Lend,” WBEZ Chicago, June 2020.
- Hans Skifter Andersen, “Motives for Tenure Choice during the Life Cycle: The Importance of Non‐Economic Factors and Other Housing Preferences,” Housing, Theory and Society, October 2010.
- “Does FHA require a minimum credit score and how is it determined?,” U.S. Department of Housing and Urban Development, accessed July 2026.
- Ted Tozer & Laurie Goodman, “The FHA and the GSEs: Coordination to Increase Access to Credit,” Urban Institute, February 2023.
- Linda Bell, “FHA vs. conventional loans: What’s the difference?,” Bankrate, June 2026.
- “When can I remove private mortgage insurance (PMI) from my loan?,” Consumer Financial Protection Bureau (CFPB), August 2023.
- Yunbo Liu, “Frictions in Mortgage Refinance Choices: Evidence from Federal Housing Administration Mortgages,” Wharton Research Data Services, December 2024.
- Own analysis of the 2024 HMDA dataset for ages 25 to 44. Only loans originating (action = 1) for purchases (loan purpose=1) of a principal residence (occupancy type = 1) were included in the calculations.
- “Cook County House Price Index,” Institute for Housing Studies at DePaul University, accessed July 2026. Includes Auburn Gresham/Morgan Park, Washington Heights, Beverly, and Mount Greenwood.
- “Highlights From the Profile of Home Buyers and Sellers,” National Association of Realtors, November 2025.
- “The 28/36 rule, explained,” Chase, April 2025.
- “B3-6-02, Debt-to-Income Ratios,” Fannie Mae, June 2026.
- Property taxes for first-time homebuyers may be lower than the median if the houses they steer towards are lower valued than the median house in Chicago.
- “Loop’s declining value fuels record 16.7% jump in median property tax bill for Chicago homeowners,” Cook County Treasurer, November 2025.
- Stephanie Zimmermann & David Struett, “Illinois home insurance prices jumped 50% in three years — second-highest in the country, study shows,” Chicago Sun-Times, April 2025.
- See the “Financial Health Pulse® 2025 Chicago Trends Report” (p. 113) for more details on defining these regions.
- “30-Year Fixed Rate Mortgage Average in the United States,” Federal Reserve Bank of St. Louis, July 2026.
- “S&P Cotality Case-Shiller IL-Chicago Home Price Index,” Federal Reserve Bank of St. Louis, July 2026.
- “Presenting Data on Housing Affordability and Supply Challenges in Chicago,” Institute for Housing Studies at DePaul University, May 2025.
- “Chicago,” Institute for Housing Studies at DePaul University, accessed July 2026.
Written by
Credit-Ready but Priced Out: Chicago’s Homeownership Affordability Gap by Neighborhood
Explore the trends. Discover new insights. Build stronger strategies.