Research Paper

Financial Health Pulse® 2022 U.S. Trends Report

Landmark Changes in Americans’ Financial Health

By Andrew Dunn, Andrew Warren, Necati Celik, Wanjira Chege

Wednesday, September 7, 2022
 Financial Health Pulse<sup>®</sup> 2022 U.S. Trends Report

Executive Summary

New Data Reveals Erosion of FinHealth Gains

Our 2022 U.S. Trends Report tells a far different story than prior years. Data from the nationally representative probability-based Pulse survey, fielded in April and May 2022, show that financial health declined for the first time in the project’s five-year history. The percentage of people considered Financially Healthy returned to pre-pandemic levels as the end of pandemic-era government benefits, inflation, and stock market volatility shaped people’s financial health. A broad swath of Americans experienced financial health declines, including some groups that historically have had high levels of financial health.

Financial health in the U.S. declined for the first time in the five-year history of Pulse research.

We find important implications of the economic upheaval and pandemic-influenced trends of the past few years. The tightening labor market appears to have had positive impacts on the financial health of workers, particularly those at the lowest income levels, and aggregate-level declines in financial health may point to the efficacy of government interventions during the COVID-19 pandemic. Though many Americans appear headed toward further reductions in financial health as inflation continues and spending, saving, and credit use revert to pre-pandemic levels, the financial health changes of the past three years have continued to suggest that government policy can positively influence financial health.

These results raise important questions about the role of government support in maintaining and safeguarding financial health, as well as the importance of quality jobs and worker power. While in 2022 we see rare declines in financial health among many traditionally privileged populations, we are also reminded of the persistent precarity that many others experience.

Key Findings

1. The proportion of people considered Financially Healthy decreased for the first time in five years of Pulse research.
  • The percentage of people considered Financially Healthy decreased from 34% in 2021 to 31% in 2022. The percentage considered Financially Coping increased from 52% to 55% in the past year, while the percentage considered Financially Vulnerable did not significantly change.
  • These declines were likely shaped by elevated inflation, the end of pandemic-era government interventions, and higher personal spending than earlier in the pandemic.
2. Declines in financial health were related to expenses outpacing incomes and reductions in savings.
  • A greater share of people said they were spending more than their income (indicator 1), did not have sufficient short-term savings (indicator 3), and did not feel confident in their long-term savings (indicator 4).
  • These declines may foreshadow declines in other indicators, such as having a prime credit score and paying all bills on time.
3. Numerous demographic and socioeconomic groups experienced declines in their financial health.
  • The percentage of Black people considered Financially Healthy declined by 6 points over the past year, from 21% to 15%. Meanwhile, the percentage of White people considered Financially Healthy declined by 4 points, from 39% to 35%.
  • The percentage of women considered Financially Healthy declined at comparable rates to men. The percentage of women considered Financially Healthy declined by 3 points, from 26% to 23%, while this percentage declined by 4 points for men, from 43% to 39%.
  • Groups that have historically had high levels of financial health also experienced significant declines: people with household incomes over $60,000, people who do not identify as LGBTQIA+, and people without disabilities. These declines were shaped by reductions in indicators of short- and long-term savings.
4. People with low incomes who were able to take advantage of a tight labor market experienced large improvements in their financial health. Meanwhile, those most impacted by inflation experienced declines.
  • People with household incomes under $30,000 who received wage increases in the same job, increased the hours they worked, or started a new job experienced large improvements in their FinHealth Scores. These associations were not present for higher-income groups.
  • Those who reported the most impact from inflation experienced larger declines in their FinHealth Scores in the past year.

Financial Health Snapshot 2022

The percentage of people spending less than their incomes, reductions in short-term savings, and confidence in long-term savings all contributed to negative trends in financial health between 2021 and 2022. The percentage of people reporting spending less than their incomes hit the lowest level since 2018, our first year of Pulse research, while other indicators remained at levels comparable to 2021.

Figure 1. Financial health indicators

Percentage point change in positive responses for each financial health indicator (2021-22).

Introduction

FinHealth Declines as the Pandemic Recedes

Over the past two years, we saw financial health consistently increase in the midst of a global pandemic. As COVID-19 claimed over a million lives in the U.S. and caused an unprecedented economic crisis, financial health rose to its highest point since Pulse research began.1, 2 This trend initially appeared contradictory: Financial health improved despite lockdowns and record unemployment, among other impacts. But massive levels of financial support offered to individuals by federal and state governments likely led to improvements in financial health during the pandemic. Personal financial behavior also changed as people increased their savings and spent less money during lockdowns.

However, 2021 was the last year people generally were shielded from eviction and received stimulus checks, expanded unemployment benefits, and Child Tax Credit advances. Pulse research and other sources cautioned of a financial health “cliff” that would occur as these policies reached their close.3, 4 While there was no singular cliff moment, as different policies ended at different times based on a variety of factors, we find that financial health did decline between 2021 and 2022 – just as most pandemic-era government financial supports are ending. Furthermore, the combination of financial market volatility and the highest inflation rate in 40 years has contributed to this “cliff” effect.

These events occur alongside a return to pre-pandemic levels of financial health, as gains from the past two years have largely been reversed. Underlying systemic disparities, which existed long before the pandemic, remain. Furthermore, greater financial health declines appear to be on the horizon as inflation shows no signs of letting up, debt levels rise, and loan delinquencies grow.5, 6, 7, 8

Methodology Summary

The data used in this report were collected from surveys fielded to participants of the University of Southern California’s Understanding America Study (UAS) probability-based internet panel. The full methodology and appendix is available in the PDF download. Visit our Data page to download Pulse survey data sets and questionnaires and to learn about our transactional data methodology.

Overview

The State of Financial Health in 2022

In the fifth year of measuring financial health in the U.S., the percentage of people considered Financially Healthy declined for the first time, from 34% in 2021 to 31% in 2022. The percentage of people considered Financially Coping increased from 52% to 55%, while the percentage of Financially Vulnerable people did not change significantly in the past year.9 These changes bring the financial health of people in the United States back in line with pre-pandemic levels; the percentages of Financially Healthy and Coping people in 2022 are not significantly different from what they were in 2019, though the percentage of people considered Financially Vulnerable remains significantly lower (Figure 4).

Figure 2. Financial health declined for the first time since 2018.

Percentage of people categorized by financial health tier (2018-22).

These findings align with other research, which show reductions in financial health and diminishing consumer sentiment over the past year. In June 2022, respondents to the Index of Consumer Sentiment reported the lowest assessment of their financial situation since 2013, with many citing inflation as a contributing factor.10 Gallup research found that 46% of consumers viewed their financial situation as either excellent or good, down from 57% in 2021.11 The Morning Consult Well-Being Scale also found that traditionally secure groups, such as people with higher incomes, have felt the effects of the current economic conditions: Individuals with incomes of $100,000 or more had the largest drop in financial well-being in the past year.12 At the same time, inflation has also eroded the wage increases experienced by people earning low incomes last year.13

Figure 3. Less than one-third of adults in the United States are Financially Healthy.

Estimated share of adults in the U.S. by financial health tier (2022).

Note: Financial health tiers are calculated using the FinHealth Score. See the Methodology section in the PDF version of this report for more on the measurement methodology. Population counts are derived from the 2022 April Current Population Survey using population estimates for U.S. noninstitutionalized adults ages 18 and older.

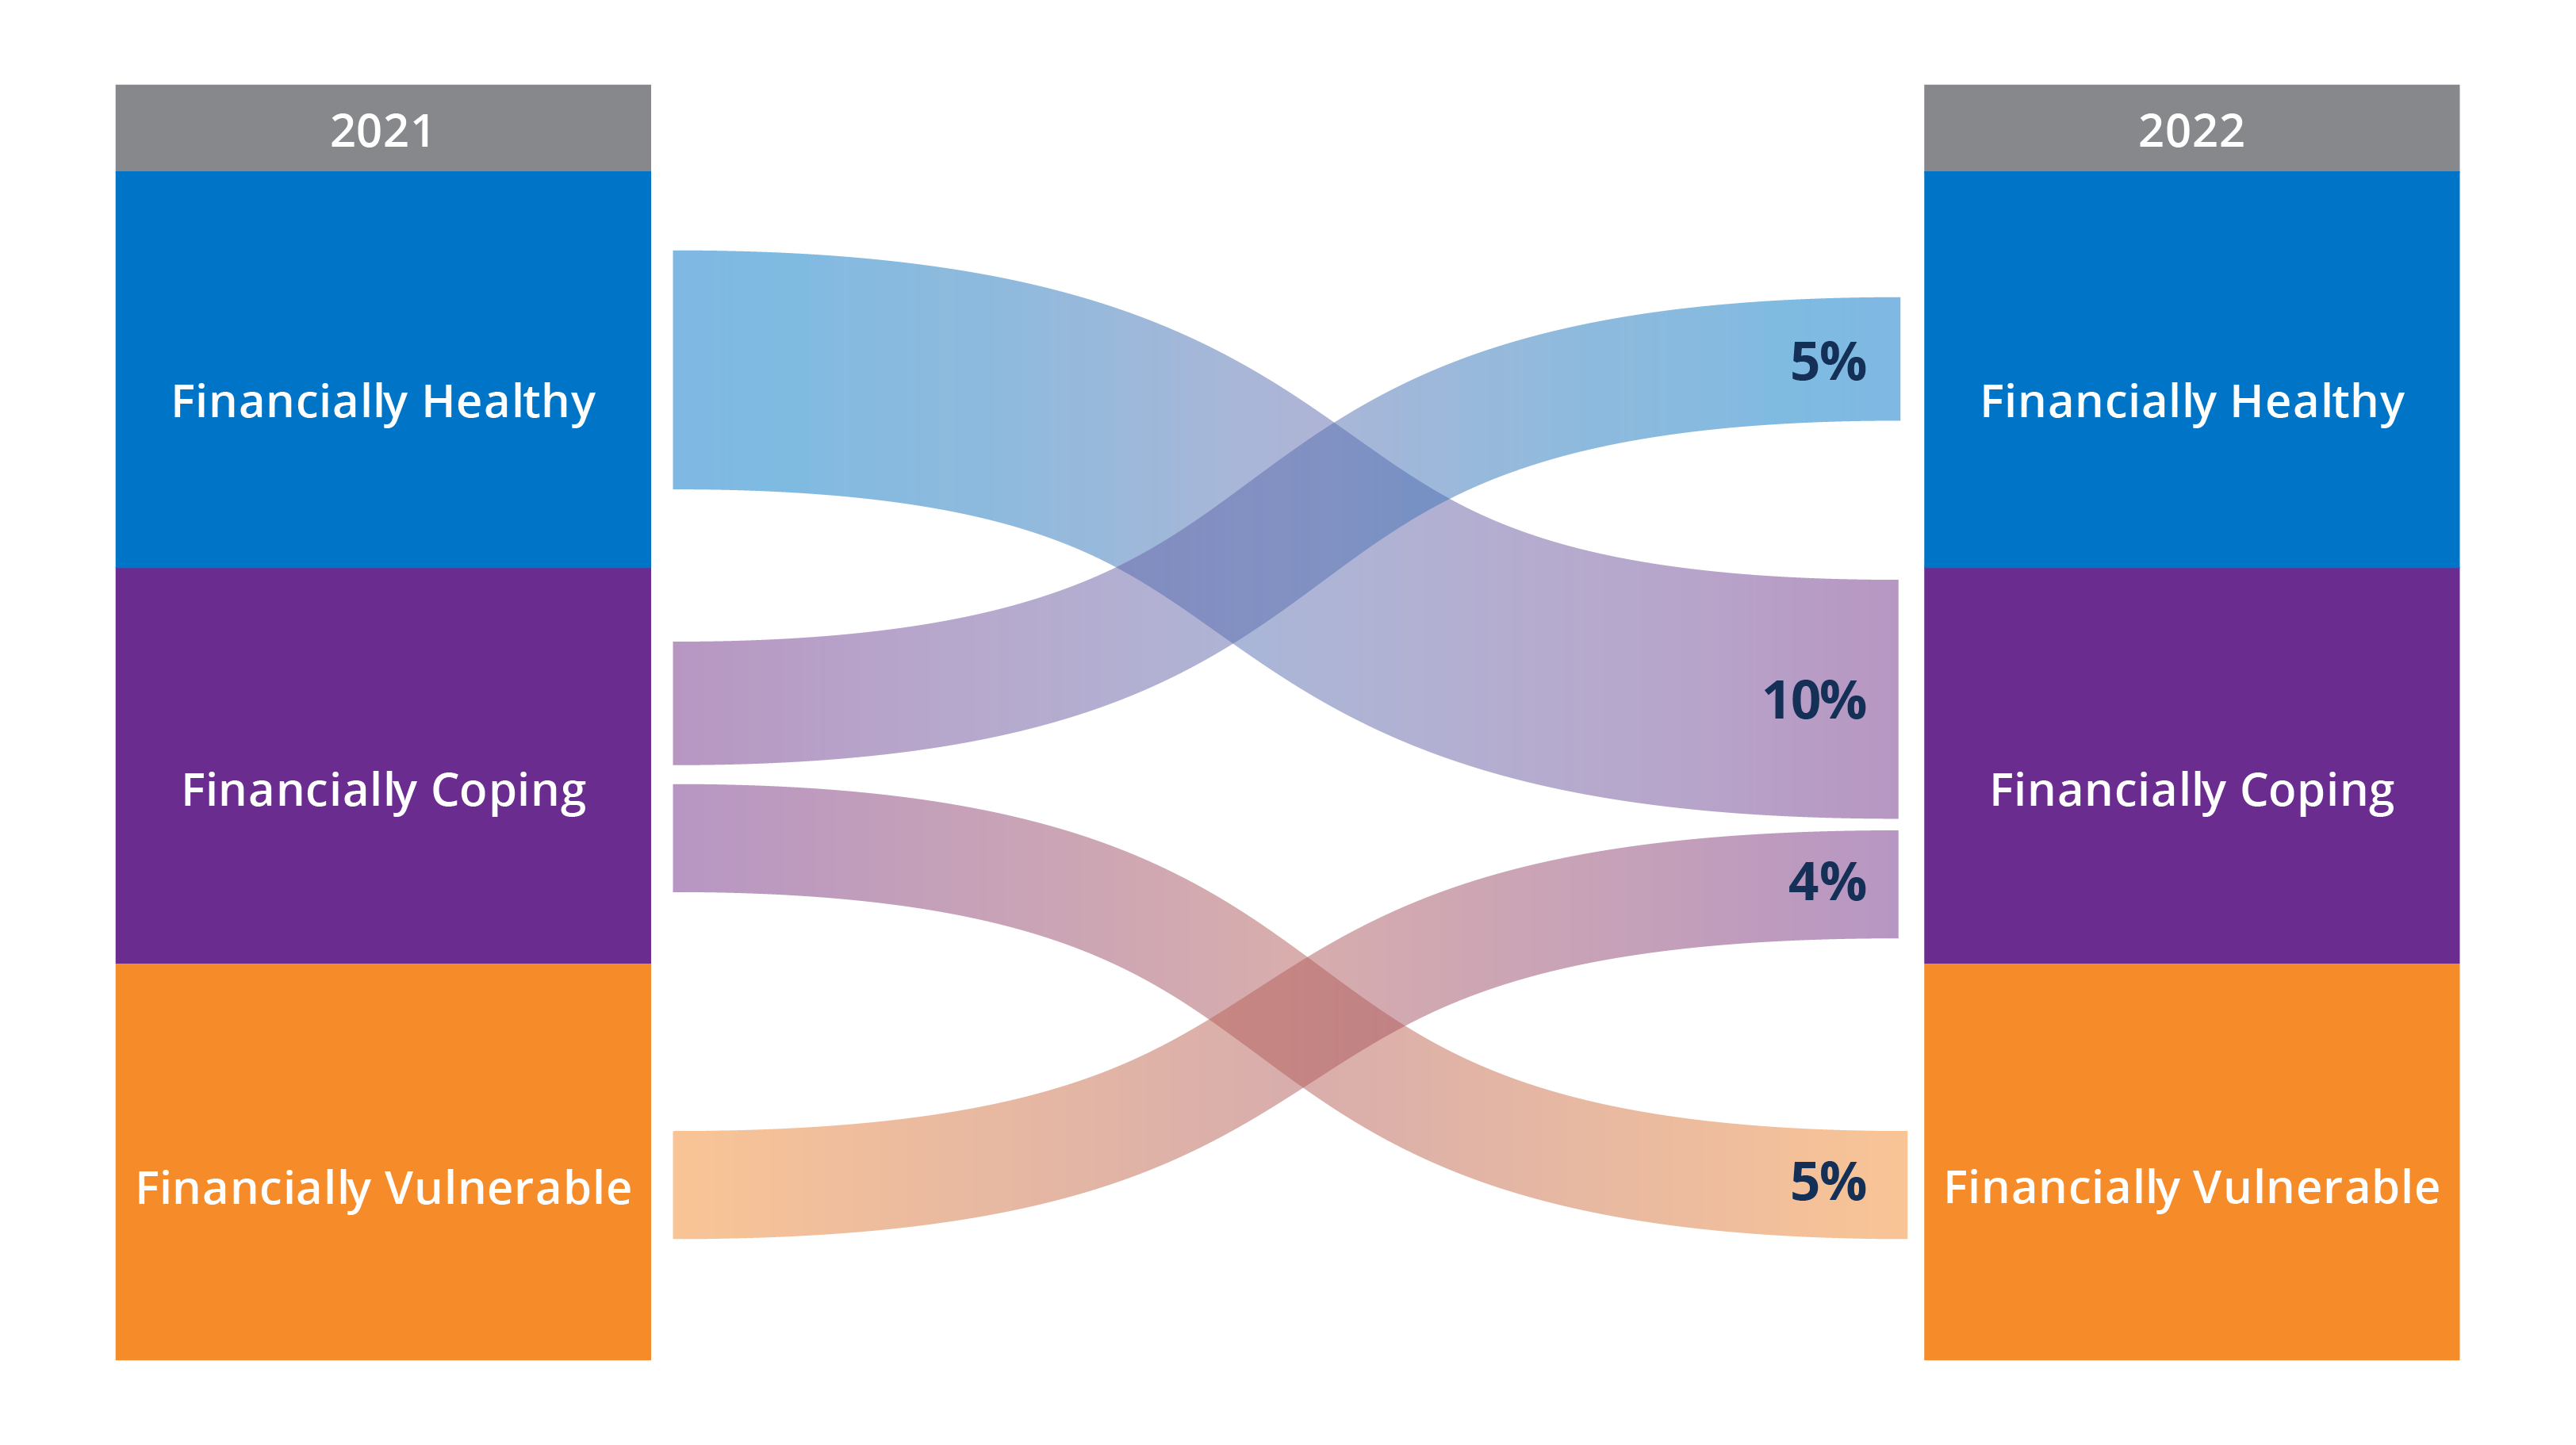
In the longitudinal sample of respondents who took Financial Health Pulse surveys both in 2021 and 2022, a larger percentage of people experienced declines in their financial health than experienced improvements. In that sample, 15% of people moved down a financial health tier and 9% of people moved up a tier in the past year. The largest change was between the Financially Healthy and Financially Coping tiers: 10% of sample respondents dropped from Healthy to Coping, while only 5% of the sample climbed from Coping to Healthy.

Figure 4. A greater percentage of people experienced financial health declines than improvements.

Percentages of people with changes in financial health tier (2021-2022).

Financial Health Indicators

The declines in financial health over the past year were related to expenses outpacing income and reductions in savings (indicators 1, 2, and 3).

Indicator 1: Spend Less Than Income
The percentage of people who reported spending less than or equal to their incomes dropped to a record low of 79% in 2022. Inflation likely contributed to this decrease, as the yearly inflation rate exceeded 8% at the end of May 2022.14, 15, 16 Meanwhile, median monthly household spending increased at a yearly rate of 7.8% in April 2022, the highest rate of increase since the Household Spending Survey was first fielded in 2014.17

Indicator 2: Pay Bills on Time
Perhaps unexpectedly, there was not a meaningful change in the percentage of people who could pay all their bills on time in the past year. Though spending has increased relative to income, other evidence suggests that people have been able to keep up with their financial obligations. For instance, Census Pulse surveys found there was virtually no change in the percentage of people caught up on their mortgage or rent payments between May 2021 and May 2022.18,19 Moreover, the Financial Health Pulse survey also indicated no significant change in the percentage of people who had trouble making rent or mortgage payments (Table B1, see Appendix B in the PDF version of this report). However, this indicator may decline in the near future if inflation continues to outpace wage growth and people use up their short-term savings to pay for their increasing expenses.

Indicator 3: Have Sufficient Liquid Savings
The percentage of people with enough savings to cover at least three months of expenses declined by 3 points in the past year, from 61% in 2021 to 58% in 2022. Despite this drop, this level remains significantly higher than the pre-pandemic levels of 2019, when 56% of people reported having three months of expenses in savings. This finding aligns with research from the JPMorgan Chase Institute showing that short-term saving reserves in 2022 were higher than 2019 levels.20,21 However, the personal savings rate has already declined to a level we have not seen since before the 2008 recession, suggesting that savings levels may decline in the future.22

Indicator 4: Have Sufficient Long-Term Savings
People’s perception of the sufficiency of their long-term savings also deteriorated in the past year. From 2021 to 2022, the percentage of people who were confident they were on track to meet their long-term financial goals declined by 3 points, from 43% to 40%. The volatility in equity markets, linked to geopolitical and economic uncertainties, removed a substantial amount of wealth from retirement accounts since the start of the year.23,24 As nest eggs have lost value, it may have become harder for people to feel confident in their ability to reach their long-term goals.

Other Indicators
There was no significant change in manageability of debt, self-reported credit scores, confidence in insurance coverage, or planning ahead financially over the past year. However, these indicators may decline in the future if people continue higher spending while their savings shrink. Other research shows that higher expenditures relative to liquidity can predict household insolvency.25 There are early signs that debt manageability may become a major issue in the near future as people deplete their savings reserves and turn to borrowing to meet their financial needs.26

Table 1.  A record-low percentage of people spent less than or equal to their incomes.

Percentage of people with positive responses for each financial health indicator (2018-22).

Financial health indicator 2018 2019 2020 2021 2022 Change in % points (2021-22)
Spending is less than or equal to income 84% 83% 86% 85% 79%* -6
Pay all bills on time 64% 66% 66% 71% 70%*  -1
Have enough savings to cover at least three months of living expenses 55% 53% 56% 61% 58%* -3
Are confident they are on track to meet long-term financial goals 40% 39% 41% 43% 40% -3
Have a manageable amount of debt or no debt 70% 70% 72% 75% 74%* 1
Have a prime credit score 66% 65% 66% 70% 70%* 1
Are confident their insurance policies will cover them in an emergency 61% 58% 60% 59% 57% -1
Agree with the statement: “My household plans ahead financially.” 60% 59% 62% 61% 62%* 0

* Statistically significant vs. 2019, the last survey conducted before the COVID-19 pandemic (p < 0.05).
Statistically significant (p < 0.05).
Note: Figures are rounded to the nearest integer. As a result, the difference between years may not sum to the values in the “Change” column.

Demographics & Socioeconomics

Financial Health Declines Affected Nearly All Groups

Financial health disparities across household income, race and ethnicity, gender, LGBTQIA+ status, and ability persisted in 2022, with groups that historically have been advantaged reporting far greater levels of financial health than underserved groups. However, some historically advantaged groups, which also typically report high levels of financial health, experienced notable drops in financial health in the past year. People with household incomes over $60,000, White people, men, people who do not identify as LGBTQIA+, and people without disabilities experienced significant declines in their financial health, mirroring the national trend (Table 2). Meanwhile, Black people and women also experienced declines in their financial health.

Declines for some of these groups may be a reflection of their already greater financial health: Unlike factors such as inflation, which likely affected virtually all socioeconomic and demographic groups, historically advantaged groups were in a position to more acutely experience reductions in long-term savings. As such, those who owned investment accounts were directly exposed to the volatility in financial markets, which may have reduced their savings. Historically marginalized groups, on the other hand, may have never had savings large enough to incur comparable declines.

Table 2. Financial health declined among historically privileged groups, as well as women and Black people.

Percentages of demographic and socioeconomic groups categorized as Financially Healthy (2021-22).

2021 2022 Change in % points
(2021-22)
Household income Less than $30,000 12% 10% -2
$30,000 to $59,999 25% 23% -2
$60,000 to $99,999 43% 36% -7*
$100,000 or more 59% 54% -4*
Race/ethnicity Asian 46% 44% -2
Black 21% 15% -6*
Latinx 25% 23% -2
White 39% 35% -4*
Multiple races 28% 27% -1
Other race/ethnicity 18% 21% 4
Gender Women 26% 23% -3*
Men 43% 39% -4*
LGBTQIA+ status LGBTQIA+ 24% 23% -1
Non-LGBTQIA+ 35% 32% -4*
Ability People without disabilities 38% 35% -4*
People with disabilities 21% 20% -1

* Statistically significant (p < 0.05).

Household Income

The large gaps in financial health across household income levels persisted in 2022.


This year, fewer people with less than $30,000 in household income continued to be considered Financially Healthy than their counterparts with higher incomes. Over the past year, the percentage of people with household incomes between $60,000 and $99,999 who are Financially Healthy declined by 7 points, from 43% to 36%, while the percentage of people with household incomes of $100,000 or more who are Financially Healthy fell from 59% to 54% in the past year. Meanwhile, there were no significant changes in the percentage of people with household incomes below $60,000 who are considered Financially Healthy. A greater percentage of people at all income levels reported spending more than their income in 2022 (Table B2).

People with household incomes below $60,000 still felt the impact of inflation on their finances, though there was not a statistically significant change in their distribution across financial health tiers. People with household incomes less than $30,000 more frequently reported some level of stress due to inflation than people with higher household incomes (Table B3). The percentage of people with household incomes less than $30,000 reporting sufficient short-term savings also significantly declined (Table B2).

There was a significant decrease in the percentage of people with household incomes of at least $60,000 who were confident they were on track to meet their long-term financial goals. Since people with $60,000 or more in household income are more likely to own long-term financial assets and are therefore more invested in equity markets, the market decline of 2022 likely had a more profound impact on their financial health than people with less than $60,000 in household income.27

Race and Ethnicity

The percentage of Black people who are considered Financially Healthy decreased by 6 points, from 21% to 15%, in the past year. This decrease eroded most of the financial health gains Black people had previously experienced between 2020 and 2021.

Increases in spending relative to income contributed to the decline, as the percentage of Black people spending less than or equal to their incomes declined by 7 points in the past year (Table B5).

The likely culprit of this change is inflation, which tends to be higher and more volatile for Black households. Research from the Federal Reserve Bank of Richmond shows that Black households allocate a greater proportion of their expenditures to essential goods, which also have volatile prices that are impacted by inflation, than White households. The difference in consumer baskets accounts for two-thirds of the difference in inflation experiences for Black and White households.28 Results from the Pulse survey also show that Black people more frequently used their savings to pay for goods, shopped at discount retailers, and carried credit card balances to cope with inflation than White people (Table B4).

White people were 4 percentage points less likely to be Financially Healthy in 2022 than the prior year, with a multitude of factors contributing to the decline. Compared with 2021 figures, a smaller percentage of White people reported spending less than or equal to their incomes, having sufficient short-term savings, having confidence in meeting their long-term financial goals, having manageable or no debt, and having confidence in their insurance coverage (Table B5). Because White people are more likely to own long-term financial assets such as retirement accounts, they are more exposed to volatility in financial markets than Black or Latinx individuals, who are less likely to own these assets.29 Market fluctuations might explain why White people experienced declines not just in the short-term aspects of their financial health, such as spending and saving, but also in long-term aspects, such as borrowing and planning. There was no significant change in the percentage of people considered Financially Healthy among Latinx people, people who indicated they were of multiple races or ethnicities, or people who selected other response options.

Despite these shifts, enduring disparities remain. A much greater percentage of White and Asian people were still Financially Healthy relative to people of other races or ethnicities. Conversely, Black and Latinx people tend to be Financially Healthy at much lower rates, reflecting historical disinvestment and segregation, structural barriers to financial health, and the continuing reality of discrimination.30, 31, 32, 33 Consequently, financial health in America and race remain deeply intertwined.

Gender

The gender gap in financial health, which expanded between 2020 and 2021, persisted in 2022, as a lower percentage of women were Financially Healthy than men. However, both men and women experienced declines in financial health over the past year. The percentage of men who are Financially Healthy declined from 43% to 39%, while the percentage of women who are Financially Healthy decreased from 26% to 23%. Declines across the eight indicators were similar between men and women in the past year: The percentage of men and women who spent less than or equal to their incomes, had sufficient short-term savings, and had confidence that they were on track to meet their long-term financial goals declined between 2021 and 2022 (Table B6).

Deep Dive: Women’s Financial Health
Recent research from the Financial Health Network examined the gender gap in financial health. Women face financial disadvantages in every facet of their finances, and they are more likely than men to report that their financial situation is worse now than prior to the pandemic. Compared with men, working-age women:

  • Have lower household incomes on average.
  • Are more likely to be subjected to workplace harassment and discrimination.
  • Report making career changes due to parenting responsibilities at higher rates.
  • Are more likely to say their current level of debt is unmanageable.
  • Are less likely to report having a retirement savings vehicle in their own name.

Closing the wage gap, building a better care infrastructure, making retirement security more accessible, and making higher education more affordable are top priorities for closing the gender gap in financial health.

LGBTQIA+ Status

The financial health gap between LGBTQIA+ and non-LGTBQIA+ people continued in 2022. 23% of people who identify as LGBTQIA+ were considered Financially Healthy versus 32% of people who do not identify as such, likely a reflection of discrimination they face when accessing resources that are critical for their well-being, such as housing and medical care.34 The percentage of Financially Healthy people among those who do not identify as LGBTQIA+ declined by 4 points, as spending increased relative to income and these individuals reported declines in savings (Table B7). Meanwhile, the financial health of people who identify as LGBTQIA+ did not change significantly in the past year.

Ability

People without disabilities experienced declines in financial health, but remained more likely to be Financially Healthy than people with disabilities. In 2022, 20% of people with disabilities were considered Financially Healthy, as opposed to 35% of people who do not have disabilities. The percentage of people without disabilities who are considered Financially Healthy decreased by 4 points; changes in their financial health indicators largely mirrored national trends (Table B8), while the financial health of people with disabilities did not change significantly. In 2023, with support from Principal Foundation, the Financial Health Network will conduct in-depth research into the financial health of people with disabilities and the financial challenges they face.

These findings suggest that groups with high levels of financial health – White people, men, those with $60,000 or more in household income, individuals identifying as non-LGBTQIA+, and people without disabilities – experienced significant declines in their financial health over the past year, along with Black people and women. These declines appear to be related to increases in spending, which was likely caused by higher inflation. Declines in long-term savings also contributed to these declines, as groups who are more likely to own long-term financial assets – people with at least $60,00 in household income and White people – felt the financial health repercussions of the downward trend in equity markets. However, these people will still be in a position to improve financially when financial markets recover, while those who do not own these assets may struggle to keep pace.

Changes for Individuals

FinHealth Changes Corresponded to Individual Experiences of Macroeconomic Trends

A tightening labor market and record-high inflation dramatically affected consumers in late 2021 and early 2022. Experiencing changes in employment circumstances and feeling the effects of price increases also had implications for peoples’ financial lives. There were key differences in financial health trends between people who experienced these events and those who did not: Positive employment changes (like receiving a raise or switching jobs voluntarily) were associated with large FinHealth Score increases, but only for people with household incomes less than $30,000 a year. Meanwhile, people who reported more stress from price increases experienced larger declines in financial health across income levels.

To determine this, we looked at the subset of 5,326 individuals who took the Financial Health Pulse survey in both 2021 and 2022 and explored associations between events they experienced over the past year (as reported in their 2022 survey responses) and changes in their FinHealth Scores. Comparing individuals with themselves across years allows us to control for a large variety of potentially confounding time-invariant variables and more directly estimate the change in financial health associated with a specific experience. In this section, we focus on change in FinHealth Score instead of movement between financial health tiers to capture more detailed variations in financial health outcomes.35

Between 2021 and 2022, the average change in FinHealth Score – the index from 0 to 100 that determines whether a person is Financially Healthy, Coping, or Vulnerable – was roughly a one-point decrease. However, this average obscures considerable heterogeneity in financial health trends that depend on a person’s particular experiences in the economy.

A Boost From Better Jobs

The tightening labor market appears to have been particularly important to the financial health of workers with household incomes less than $30,000 a year.

People with household incomes in this range who received wage increases in the same job, increased the hours they worked, or voluntarily got a new job saw large improvements in their FinHealth Scores relative to workers in the same income bracket who did not experience these events. Those in the same income group who received a raise or increased hours at their jobs experienced an eight-point increase in their FinHealth Score relative to those who did not, and those who switched jobs voluntarily experienced a nine point increase (Figure 5).

There was no statistically significant association between these events and FinHealth Score changes for higher-income groups, possibly because modest increases in income are less likely to have a dramatic effect on the ability of those with higher incomes to meet their spending needs. Considering that people with household incomes of less than $30,000 had an average FinHealth Score of about 54 points in 2021, an eight-point change represents a substantial shift in financial circumstances for this group (roughly a 15% score increase at the mean).

Figure 5. People with household incomes less than $30,000 who experienced a positive employment event increased their FinHealth Scores.

Despite these findings, people with household incomes less than $30,000 did not experience significant increases in financial health on average between 2021 and 2022. This may be in part because positive employment changes were relatively rare for this group. People at this income level were far less likely to be employed than those in higher-income households, and even those who were employed received raises less frequently (Tables B9 and B10).36

Painful Price Increases

Inflation likely affected the finances of every person in the U.S. to some degree, but respondents’ subjective assessments of inflation’s toll varied widely.

The most common categories for which people reported price changes impacting their standard of living were food (38%); transportation, including gasoline (38%); and utilities (30%).37 People were less likely to report impact in healthcare (18%), housing (16%), education (6%), and child care (5%). In most spending categories, a greater percentage of people with household incomes less than $30,000 reported a standard of living impact from inflation than people from households with incomes of $100,000 or more (Table 3).

Table 3.  People with low incomes reported inflation impacts more frequently.

Percentage of people reporting at least a moderate impact on standard of living in each spending category, by 2021 household income.

Overall Less than $30,000 $30,000 to $59,999 $60,000 to $99,999 $100,000 or more
Food 38% 45% 44% 35%* 27%*
Transportation 38% 40% 44% 38% 28%*
Utilities 30% 38% 35% 26%* 20%*
Healthcare 18% 18% 21%* 17% 15%*
Housing 16% 22% 19% 10%* 11%*
Education 6% 8% 5%* 4%* 6%
Child care 5% 5% 4% 5% 4%

* Statistically significant vs. those with household incomes less than $30,000.

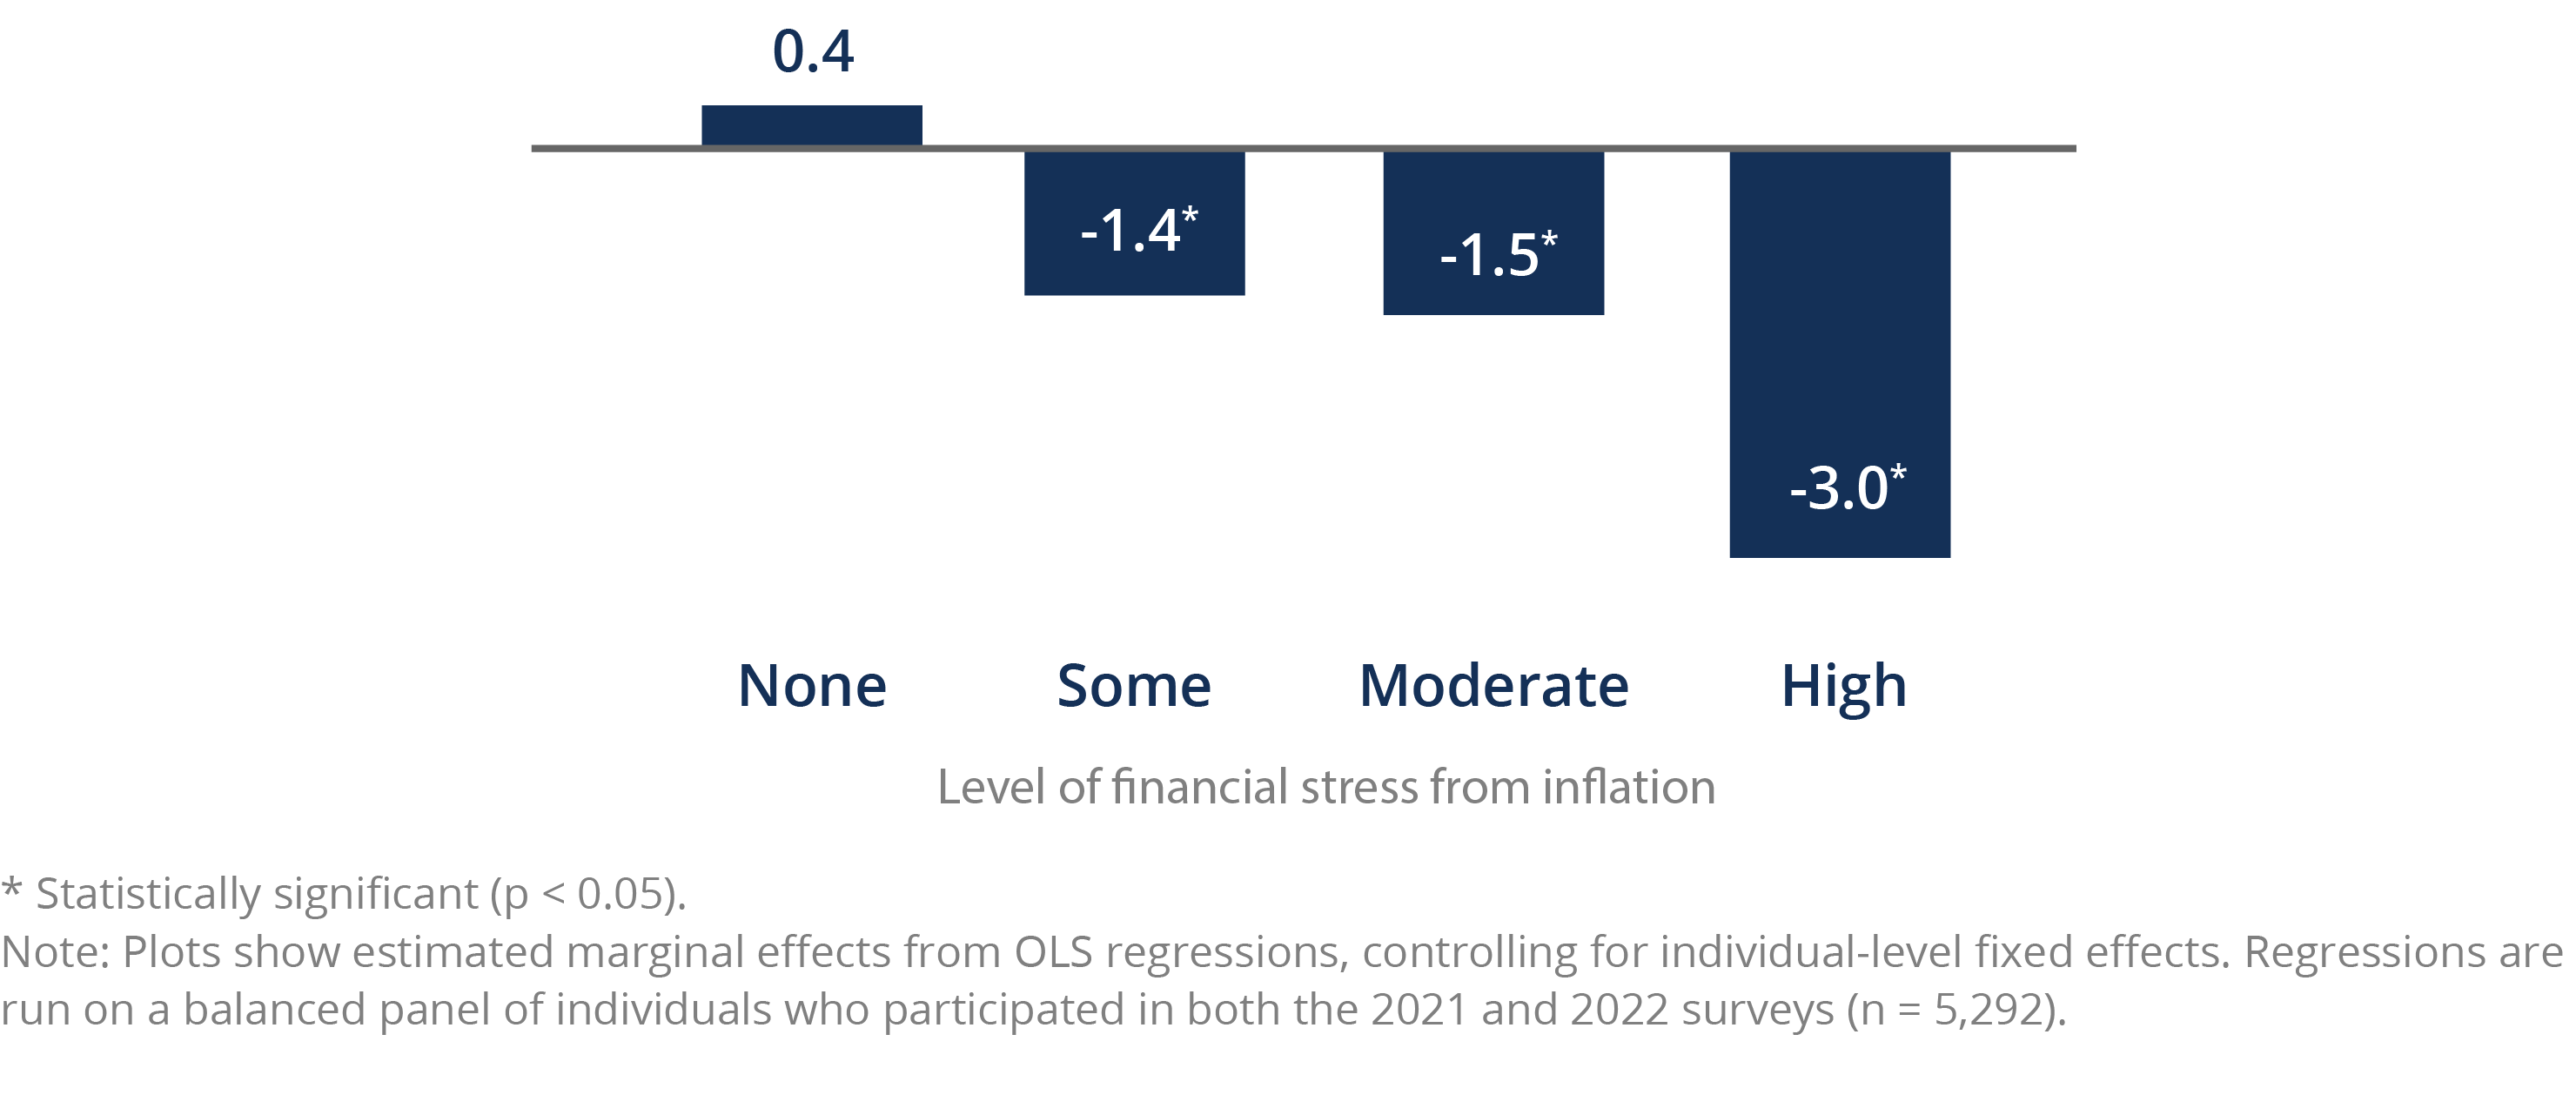
The degree of financial stress that respondents attributed to recent price increases varied widely: 29% of people reported feeling moderate or high financial stress from inflation, while 37% reported feeling no stress at all (Table B11). There was also a relationship between the level of stress reported and changes in financial health (Figure 6). Those who reported a high level of stress experienced an average decrease of three points between 2021 and 2022, about three times the mean FinHealth Score decrease in the population overall. Those who reported no stress or said they did not notice price changes did not experience a statistically significant score change. Respondents reporting “moderate” or “some” stress experienced decreases of about 1.5 points, closer to the average score change for the entire sample.38

Figure 6. Level of stress from inflation is associated with change in FinHealth Score.

Estimated FinHealth Score change relative to the prior survey year, by level of inflation-induced financial stress.

Waning government assistance may also explain some individuals’ notable decreases in financial health from 2021 to 2022. For example, the 2021 Pulse survey was fielded soon after the final round of relief payments from the federal government, which temporarily boosted checking and savings balances.39 Likewise, advance Child Tax Credit payments ended in December 2021 and several aspects of expanded federal unemployment assistance expired in September 2021.40, 41 The expiration of these programs likely affected the financial health of the families receiving them relative to those who were not. Unfortunately, the timing and frequency of the Pulse survey do not allow us to reliably estimate the effects of their expiration.

These findings illustrate that two major macroeconomic trends – inflation and a tightening labor market – were not experienced uniformly in the U.S., and that financial health changes over the past year were associated with those experiences. The ability to capitalize on tight labor market conditions was an important indicator of financial health mobility for people in households with incomes under $30,000, but these same people were also much less likely to be in a position to benefit from those conditions. Low-income households also bore the brunt of inflation’s impact, and those who reported more stress from inflation experienced worse financial health outcomes.42 However, these correlations are not so strong that people with low incomes experienced larger average score decreases overall. For people with low incomes and very low FinHealth Scores already, adverse effects from inflation may not be detectable in their scores.

Conclusion

Uncertainty Continues to Loom for Financial Health in the US

Our findings confirm that 40-year highs in inflation, stock market turmoil, and the removal of government support during the COVID-19 pandemic coincide with a decline in financial health for the first time in five years of Pulse research. The United States has returned to pre-pandemic levels of financial health, though the percentage of people considered Financially Healthy remains higher than 2018, when we first started our research.

There are signs that further financial health declines may be on the horizon. As the Federal Reserve continues to weigh inflation versus a potential recession, neither option bodes well for consumer financial health. And as the worst of the COVID-19 pandemic seemingly retreats into the past, increased consumer spending, reduced savings, and an overall return to pre-pandemic financial trends point to further reductions in other aspects of financial health, such as paying bills on time, credit score, and manageable debt.

The precarity of the current environment and the potential for further financial health declines on the horizon raise important questions about how government, employers, and financial service providers can engage to safeguard and improve financial health. Now that stimulus payments and other pandemic-era supports have ended, lawmakers must contend with large-scale concerns of inflation and combating the risk of continued financial health degradation and increased vulnerability. Our results show that some workers benefited from a tight labor market, suggesting that employers can do more to directly support increased financial health of their workers. Financial service providers must continue to combat financial health disparities across race and ethnicity after reductions in previous years have proved to be short-lived, pointing to the need for new solutions that can pave the way toward financial health for all.

Acknowledgments

The Financial Health Network is grateful to the members of the Financial Health Pulse
Advisory Council for guiding the strategic direction of the initiative:

Dedrick Asante-Muhammad
NCRC

Jo Ann Barefoot
Alliance for Innovative Regulation (AIR)

Ray Boshara
Federal Reserve Bank of St. Louis

Jimmy Chen
Propel

Austin Clemens
Washington Center for Equitable Growth

Cathy Cohen
The GenForward Survey

Michael Collins
The Center for Financial Security

Linda Goler Blount
Black Women’s Health Imperative

Fiona Greig
JPMorgan Chase Institute

Michal Grinstein-Weiss
Washington University in St. Louis

Adrian Haro
The Workers Lab

Shaheen Hasan
Target Foundation

Dean Karlan
Kellogg School of Management

Roderick K. King
University of Maryland Medical System

Ray Kluender
Harvard Business School

Mo Khalil
ANZ Banking Group Ltd.

Gary Koenig
AARP Public Policy Institute

Tim Lucas
SaverLife

Signe-Mary McKernan
Urban Institute

Genevieve Melford
Aspen Institute Financial Security Program

Sarah Morgenstern
Flourish Ventures

Amelia Parnell
NASPA, Student Administrators Professionals in Higher Education

Ramonia Rochester
National Disability Institute

Rachel Schneider
Canary

Ellen Seidman
Urban Institute

Lebaron Sims
Demos

Ann Solomon
Inclusiv

Evelyn Stark
Accion

Katherine Y. Tossas
Virginia Commonwealth University

Shaan Trotter
Center for Medicare and Medicaid Services

Luz Urrutia
Opportunity Fund

Amanda Utevsky
LendingClub

Justine Zinkin
Neighborhood Trust Financial Partners

The report authors would also like to thank their current and former colleagues at the Financial Health Network for their contributions to this report and for their ongoing support of the initiative: Fawziah Bajwa, Naomi Adams Bata, Angela Fontes, Thea Garon, Meghan Greene, Tanya Ladha, Rob Levy, Jess McKay, Dan Miller, Jacquelyn Reineke, Helen Robb, David Silberman, and Chris Vo.

The Financial Health Pulse is supported by the Citi Foundation, with additional funding from Principal Foundation. The findings, interpretations, and conclusions expressed in this piece are those of the Financial Health Network and do not necessarily represent those of our funders or partners.

Citi Foundation

The Financial Health Network is collaborating with the University of Southern California’s Dornsife Center for Economic and Social Research to field the survey to its online panel, the Understanding America Study. Study participants who agree to share their transactional and account data use Plaid’s data connectivity services to authorize their data for analysis.

USCDornsife

Financial Health Pulse® 2022 U.S. Trends Report

Landmark Changes in Americans’ Financial Health

To access appendices and methodological details, download the PDF version of the report.

Download the Report

Endnotes
  1. Coronavirus in the U.S.: Latest Map and Case Count,” New York Times.
  2. Andrew Dunn, Thea Garon, Necati Celik, & Jess McKay, “Financial Health Pulse: 2021 U.S. Trends Report,” Financial Health Network, October 2021. 
  3. Jeanna Smialek & Ben Casselman, “This Is Going to Hurt,” New York Times, June 2022.
  4. Katherine G. Giefer, “Harder to Pay the Bills Now That Child Tax Credit Payments Have Ended,” U.S. Census Bureau, February 2022.
  5. Consumer Price Index News Release,” U.S. Bureau of Labor Statistics, June 2022.
  6. U.S. National Consumer Credit Trends Report: Originations,” Equifax, June 2022.
  7. Quick Guide: Identifying Resilient Consumers Amidst Rising Inflation,” TransUnion, May 2022.
  8. Andrew Haughwout, Donghoon Lee, Daniel Mangrum, Joelle Scally, & Wilbert van der Klaauw, “Historically Low Delinquency Rates Coming to an End,” Federal Reserve Bank of New York, Liberty Street Economics, August 2022.
  9. In 2020 and 2021, some participants received stimulus checks shortly before they responded to the Financial Health Pulse surveys. If people in the US of all income groups are indeed myopic in self-assessing their financial situation as Sass and Ramos-Mercado (2015) suggest, a recent influx of liquidity could have had a positive effect on respondents’ assessment of their financial health. The absence of this temporary “stimulus effect” in 2022 might explain some of the decline in financial health between 2021 and 2022.
  10. Surveys of Consumers,” University of Michigan, June 2022.
  11. Jeffrey M. Jones, “U.S. Personal Finance Ratings Slide Amid Rising Prices,” Gallup, April 2022.
  12. Charlotte Principato, “The Financial Well-Being Scale,” Morning Consult, July 2022.
  13. Archana Pyati, “New and Noteworthy: Research on inflation’s impact on low-income families, parental labor force attachment, and more,” WorkRise Network, May 2022.
  14. Surveys of Consumers: Selected Reasons for Opinions About Household Financial Situation,” University of Michigan, June 2022.
  15. Joanne Hsu, “May 2022 survey results,” University of Michigan, May 2022.
  16. Consumer Price Index for All Urban Consumers: All Items in U.S. City Average,” Federal Reserve Bank of St. Louis, May 2022.
  17. SCE Household Spending Survey,” Center for Microeconomic Data, Federal Reserve Bank of New York.
  18. Week 29 Household Pulse Survey: April 28 – May 10,” U.S. Census Bureau, May 2021.
  19. Week 45 Household Pulse Survey: April 27 – May 9, 2022,” U.S. Census Bureau, May 2021.
  20. Analysis was not adjusted for inflation.
  21. Fiona Greig & Erica Deadman, “Household Pulse: The State of Cash Balances through March 2022,” JPMorgan Chase Institute, June 2022.
  22. Personal Saving Rate | FRED,” Federal Reserve Bank of St. Louis.
  23. Hites Ahir, Nicholas Bloom, & Davide Furceri, “Global Economic Uncertainty, Surging Amid War, May Slow Growth,” International Monetary Fund, April 2022.
  24. Fidelity® Q1 2022 Retirement Analysis: Retirement Savers ‘Stay the Course’ Despite Market Volatility,” Fidelity® Investments, May 2022.
  25. Sharon A. Devaney & Ruth H. Lytton, “Household insolvency: A review of household debt repayment, delinquency, and bankruptcy (1995),” Financial Services Review, 1995.
  26. Total Household Debt Increases in Q1 2022, Driven by Mortgage and Auto Balances,” Federal Reserve Bank of New York, May 2022.
  27. In the 2022 Financial Health Pulse survey, only 29% of people with less than $60,000 in household income reported having an employer provided or an individual retirement account, whereas 72% of people with $60,000 or more in household income reported having one of those accounts.
  28. Munseob Lee, “Do Black Households Face Higher and More Volatile Inflation?,” Federal Reserve Bank of Richmond, July 2022.
  29. In the 2022 Financial Health Pulse survey, 54% of White people, 39% of Black people, and 41% of Latinx people reported having an employer-provided or an individual retirement account.
  30. Peter Christensen & Christopher Timmins, “Sorting or Steering: Experimental Evidence on the Economic Effects of Housing Discrimination,” National Bureau of Economic Research, NBER Working Paper Series, July 2018.
  31. Linda Darling-Hammond, “Unequal Opportunity: Race and Education,” Brookings, March 1998.
  32. Meghan Greene, Elaine Golden, Hannah Gdalman, & Necati Celik, “FinHealth Spend Report 2022,” Financial Health Network, April 2022.
  33. Lincoln Quillian, John J Lee, & Mariana Oliver, “Evidence from Field Experiments in Hiring Shows Substantial Additional Racial Discrimination after the Callback,” Social Forces, April 2020.
  34. Andy Bandyopadhyay & Warren Dailey, “Queer Financial Health: Checking the Pulse During the Pandemic,” Financial Health Network, July 2021.
  35. In earlier sections of the report, we focus on movement between tiers to succinctly communicate changes in the entire distribution of FinHealth Scores and to help the reader interpret these changes with our qualitative descriptions of each tier.
  36. We do not find statistically significant differences in frequencies of switching jobs voluntarily or receiving increased hours between high- and low-income employed respondents (Table B10).
  37. Respondents answered a question asking if they had noticed price changes in seven spending categories. Those who said prices increased were asked: “Please think about your ability to maintain your household’s standard of living. Compared to last year, how much have price increases impacted your ability to maintain your standard of living in these categories?” Response options were: “No impact,” “minor impact,” “moderate impact,” and “major impact.” Percentages reported are those responding “moderate” or “major,” out of all respondents.
  38. When we quantify inflation impact by summing together self-reported quality of life impact across spending categories, we find similar results. Those who reported the most severe impact across the most number of spending categories experienced the largest score decreases on average.
  39. Andrew Dunn, Helen Robb, Jess McKay, Necati Celik, & Thea Garon, “Pulse Points Spring 2021: The Effects of Stimulus Payments and Tax Refunds on Consumer Finances,” Financial Health Network, June 2021.
  40. Leah Hamilton, Stephen Roll, Mathieu Despard, Elaine Maag, Yung Chun, Laura Brugger, & Michal Grinstein-Weiss, “The impacts of the 2021 expanded child tax credit on family employment, nutrition, and financial well-being,” Brookings, April 2022.
  41. Expiration of Federal Unemployment and Pandemic Benefits,” New York State Department of Labor.
  42. Importantly, our results are not estimates of the causal impact of employment changes and inflation on financial health, because these events could be correlated with other changes over the past year that we are unable to observe in our data. Still, they reflect trends reported in other research. The Federal Reserve Bank of Atlanta’s Wage Growth Tracker shows that wages grew faster for job switchers than job stayers over the past year. Other recent research has established a variety of ways that inflation impacts low-income households more severely.
  43. Weighting factors used were gender, race/ethnicity, age, education, and Census region.