FinHealth Spend Report 2022
By Elaine Golden, Hannah Gdalman, Meghan Greene, Necati Celik, Ph.D.
-
Program:
-
Category:
-
Tags:

Executive Summary
This year’s annual FinHealth Spend Report examines how households in America managed their finances and accessed credit during the second year of the pandemic, analyzing year-over-year trends for more than two dozen financial products and services.
In 2021, households reduced their credit card debt and reliance on alternative financial services with help from stimulus payments and other government support. They also saved billions in student loan expenses due to the continued moratorium on federal student loans. Spending on total interest and fees declined to $305 billion in 2021 from a high of $319 billion in 2020.1
Yet, disparities in total fees and interest paid by race, ethnicity, and income remain vast, demonstrating little change year over year. The costs to access financial services continue to weigh heavier on traditionally underserved populations.
We estimate that, on average, Black households spent more than twice what White households spent on interest and fees as a percentage of their income (7% vs. 3%), while Latinx households spent 1.4 times more than White households (5% vs. 3%). Households with low-to-moderate (LMI) incomes spent nearly three times more of their income on interest and fees than higher-income households (8% vs. 3%).
Figure 1. Percentage of Household Income Spent on Interest and Fees
Product Trends
We examine in detail interest and fees paid for specific products, estimating spending by segment and drawing out key insights and trends. Expanded data tables are available in Appendix I, available in the PDF version of this report.
Percentages throughout this report have been rounded. All incidence comparisons in text are statistically significant at the 95% confidence level unless otherwise noted.
Overdraft/Nonsufficient Funds (NSF) Fees
- Overdraft and NSF fees remained fairly steady year over year, totalling roughly $11 billion both in 2020 and 2021.
- This comes after a contraction from 2019, when fees totaled $15.5 billion.
- Following recent announcements of overdraft reform by several major banks, we may see substantial shifts in this market in 2022.
- Black households with bank accounts were 1.8 times as likely as White households to report having paid at least one overdraft fee, while Latinx households were 1.4 times more likely.
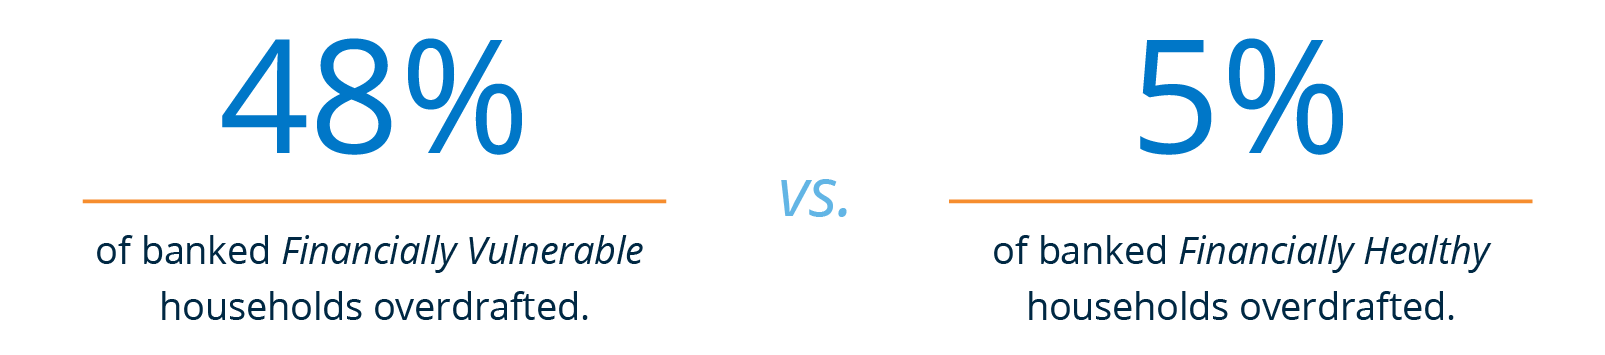
- Financially Vulnerable households with bank accounts were nearly 10 times as likely to overdraft as Financially Healthy households.
Figure 2. Overdraft/NSF Fees
Total estimated annual fees in billions.
Student Loans
- Although federal student loans comprise 92% of the $1.7 trillion student loan portfolio, we estimate that interest and fees paid by private student loan borrowers in 2021 exceeded those paid by federal student loan borrowers ($8.5 billion vs. $6.3 billion).2
- Interest and fees on federal student loan totals fell precipitously from an estimated $25 billion in 2019, due to the federal student loan moratorium, which went into effect in March 2020. As of this report’s publication in April 2022, the moratorium is set to expire after August 31, 2022.
For every month that the moratorium is extended, we estimate that federal student loan borrowers avoid $1.5 billion in interest payments.3
Figure 3. Estimated Interest and Fees from Student Loans by Type
2019-21, in billions
Credit Cards
- Interest and fees on revolving balances for both general purpose and private label cards declined in 2021, as stimulus payments and other government benefits enabled some families to pay down credit card debt early in the year.
- General purpose credit card fees and interest dropped an estimated 10% to $95 billion, while private label credit card fees and interest dropped an estimated 13% to $11.4 billion.
- However, balances rose closer to pre-pandemic levels in the second half of 2021, with a record jump in the final quarter of 2021.4
Figure 4. Interest and Fees on Revolving Balances
2020-2021, in billions
Pawn, Payday, and Title Loans
- While changes between 2020 and 2021 were relatively small, interest and fees from pawn, payday, and title loans have dropped dramatically since 2019. Payday loans in particular saw significant usage drops that were closely aligned with the timing of the three stimulus payments.5
- Our survey found that the percentage of households reporting usage of payday loans dropped from 5% in 2020 to 3% in 2021, with meaningful drops in usage by Black households (from 10% to 6%), households with low-to-moderate (LMI) incomes (from 7% to 5%), and Financially Vulnerable households (from 14% to 9%).
Figure 5. Alternative Credit Products Show Deep Drops
2019-2021, in billions
Buy Now, Pay Later (BNPL)
- BNPL services, which have been the focus of heightened regulatory attention in recent months, are still quite small compared with the size of the credit card market by revenue.
- However, customers who are struggling in several areas of their financial lives use BNPL disproportionately.
See our supplemental BNPL brief for additional analysis.
Installment Loans
- Households spent an estimated $26.2 billion on interest and fees for both bank and nonbank installment loan products in 2021.8 This is roughly flat from 2020.
- Installment loans for borrowers with prime credit carried average interest rates of 13%, while those with subprime or limited credit paid an estimated 27% on average.9
- At the high end, some annual percentage rates (APRs) even topped 100%.10
Auto Loans
- Overall fees and interest for used and new auto loans increased in 2021 to a combined estimate of $85.4 billion as average loan sizes increased.6 This is partially attributable to the inventory shortages and supply chain issues that have plagued auto dealerships.
- Buy here, pay here (BHPH) auto loans, which carry very high rates and are targeted at customers with subprime credit or no credit score, brought in an additional estimated $8.7 billion in interest and fees in 2021.
- Fully one-third of borrowers are unable to make payments and consequently lose their vehicles.7
Insurance
- We estimate that consumers paid a total of $500 billion in premiums on homeowners, life, auto, and renters insurance products in 2021, a $21 billion increase over 2020. (Note that this category is not included in the total for interest and fees.)
- The first half of 2021 saw the largest growth of life insurance policy sales in almost 40 years.11 Our survey found increased demand from both households with low-to-moderate (LMI) incomes and those with higher incomes, as well as both White and Black households.
- Homeowners insurance also grew, due largely to a soaring real estate market.12
Looking Ahead
As 2021 came to a close, spending on several products began rising to pre-pandemic levels, with accordant increases in interest and fees. For example, while credit card balances fell dramatically in the early days of the pandemic, balances jumped toward the end of the year. Balances on installment loans also grew in the second half of 2021, as did overdraft fees – though this may be moderated by the ongoing overdraft reform efforts.
If household spending continues to grow, interest rates increase as expected, and the remaining government supports end as projected, we anticipate that 2022 will bring an increase in overall interest and fees on financial services. Households that are struggling financially will likely feel these impacts most acutely.
In addition to our annual report, FinHealth Spend Research produces briefs and analyses of various products throughout the year. We invite you to explore all of our 2022 research, learn about the methodology that informs all our research this year, and access a primer on how we define and measure financial health.
Spending Dropped From 2020, but Significant Disparities Remain
Populations that traditionally have been underserved continue to bear an outsized proportion of the costs for financial services.
Overall spending on interest and fees totaled an estimated $305 billion in 2021, a 4% contraction from 2020.13 We attribute this drop largely to declines in general purpose credit card balances and the federal student loan moratorium. Toward the end of 2021, many product categories began to return to pre-pandemic trends.
However, we see massive disparities in spending by race and ethnicity, income, and financial health tier. These generally are in line with the disparities also seen in 2020 and reflect economic and racial inequities in access to affordable financial services, as well as deep-seated systemic and structural barriers for people of color.14 In short, traditionally underserved households continue to bear an outsized proportion of the costs for financial services.
Race and Ethnicity
Black and Latinx households spent greater proportions of their income on financial services than White households. We estimate that, as a percentage of their income, Black households spent more than twice what White households spent on interest and fees (7% vs. 3%), while Latinx households spent 1.4 times more (5%).
Black and Latinx households disproportionately carry the weight of high-cost credit, like payday and pawn loans, reflecting disparities in access to mainstream financial services. For example, we estimate that Black and Latinx households account for over half of interest and fees on payday loans (22% and 29%, respectively), despite comprising less than a third of the population (12% and 17%, respectively).
Income
As a percentage of their income, low- to moderate-income households spent close to three times more on interest and fees than higher-income households (8% compared with 3%).15 We estimate that while LMI households were 50% of our sample, they accounted for 57% of fees on transaction and deposit services, like overdraft and money orders.
Financial Health
Households that are not Financially Healthy (i.e., Financially Coping or Financially Vulnerable) spent an estimated $252 billion in 2021, driving 83% of all fees and interest, despite comprising 65% of the population. Financially Vulnerable households spent 14% of their incomes on interest and fees, vs. 1% for the Financially Healthy.16
Figure 6. Percentage of Total Spending on Interest and Fees
Compared to Percentage of Population
By household financial health tier
Transaction and Deposit Services
In this section, we analyze the fees incurred to utilize a variety of services that facilitate transactions or are associated with bank accounts. We provide detailed analysis of:
- Overdraft and other account fees
- Remittances and prepaid cards
Table 1. Transaction and deposit services, estimated fees, and reported incidence of product use.
| Total estimated fees in billions | Household incidence | ||||
|---|---|---|---|---|---|
| Product | 2020 | 2021 | % change | 2020 | 2021 |
| Account maintenance fees | $5.0 | $4.8 | -4% | 19%ψ | 19%ψ |
| ATM fees | $2.0 | $2.3 | +15% | – | 37%ψ |
| Check cashing, nonbank | $1.6 | $1.5 | -3% | 5% | 4% |
| International remittances | $8.5 | $8.9 | +5% | 8% | 9% |
| Money orders | $0.9 | $0.9 | +2% | 17% | 18% |
| Overdraft/NSF17 | $11.4 | $10.7 | -6% | 16%ψ | 17%ψ |
| Prepaid cards18 | $6.2 | $7.2 | +17% | 15% | 16%* |
| TOTAL | $35.4 | $36.4 | +3% | ||
* Statistically significant difference from 2020 incidence rate (p < 0.05).
ψAmong households who have a checking/savings account or (for 2021) had closed a checking account in the past 12 months. Appendix II, available in the PDF version of this report, lists financial services for which our methodology of calculating total estimated fees has changed since our last published report. All 2020 data have been updated to align with the most recent methodology to make year-over-year comparison possible.
Appendix II also lists the changes in survey questions used in calculating household incidence.
Overdraft and Other Bank Account Fees
This year, we have estimated three types of fees associated with savings or checking accounts at a bank or credit union: overdraft (including NSF), maintenance fees, and ATM fees. Of these, overdraft has the lion’s share, comprising close to two-thirds of all account fees.19
Overdraft/NSF fees remained fairly steady year over year, totalling roughly $11 billion both in 2020 and 2021.20 This comes after a contraction from 2019, when fees totaled $15.5 billion. Importantly, the percentage of households in our survey reporting more than 10 overdraft fees in 2021 increased significantly vs. 2020, rising from 7% to 10% of all overdrafters. This shift appears to be driven by households who overdrafted six to 10 times in 2020 reporting an even greater number of overdrafts in 2021.
Figure 7. The share of Overdrafters Reporting More Than 10 Overdrafts Grew from 2020 to 2021
Number of overdrafts reported by households who report 1+ overdrafts by percent
* Statistically significant difference between 2020 and 2021 values (p<0.05).
As in 2020, we see disparities in reported incidence of bank fees by financial health, income, and race and ethnicity. Black households with accounts were 1.8 times as likely as White households to report having overdrafted in 2021 – similar to the rates we saw in 2020 – and banked Latinx households were 1.4 times as likely. Among Financially Vulnerable households, 48% with accounts overdrafted at least once in 2021, nearly 10 times more than the 5% of Financially Healthy households who overdrafted.21
Beyond overdraft, we also explore maintenance fees and ATM fees at banks and credit unions. While we estimate that maintenance fees totaled $4.8 billion in 2021 – a slight dip from 2020 – we saw a rebound in ATM fees (from $2.0 billion to an estimated $2.3 billion), perhaps as more households returned to more typical usage patterns.22
Overall, 49% of banked households reported paying some type of fee for their bank accounts in 2021. Households who are struggling financially paid far greater fees than those who are more stable. On average, banked Financially Vulnerable households paid $182 in fees in 2021, while Financially Healthy households paid just $11.
A Sea Change in Overdraft
Beginning in mid-2021 and continuing into 2022, numerous institutions announced plans to eliminate overdraft, reform overdraft practices, and/or institute overdraft alternatives.23 This suggests that overdraft usage and costs may decline in 2022.24
Remittances and Prepaid Cards
International remittances defied the precipitous drops projected due to the pandemic. Instead, we estimate only an 8% drop – from $9.2 billion in 2019 to $8.5 billion in 2020 – as users focused on supporting family and friends abroad, aided by government stimulus.25 In 2021, we estimate that international remittances climbed to $8.9 billion.
Open-loop prepaid loads – including general purpose reloadable (GPR) cards, payroll cards, and some government prepaid cards – also generally received a boost from pandemic-related surges in government assistance, as well as increasing digital payments. In fact, funds administered through government-provided prepaid cards increased 200% from 2019 to 2020, driven mostly by a surge in unemployment benefits.26 While GPR and payroll cards continued their growth trajectory in 2021, government prepaid card fees decreased in 2021, attributed to a leveling off from this 2020 peak in benefits.
What About Earned Wage Access?
There is an ongoing debate regarding whether earned wage access (EWA) products should be regulated as credit. These products are designed to address liquidity challenges and provide a means for consumers to access wages before payday or the day funds are accessible.27 We collected data on different types of EWA in our survey, finding that only 5% of respondents who work for an employer have access to EWA products.28 We will explore this market further in a future publication.
Credit Services
This section explores the interest and fees that consumers paid for a wide range of credit products in 2021. We provide detailed analysis of:
- Payday, pawn, and title loans
- Credit cards
- Auto loans
- Installment loans
- Student loans
Table 2. Credit services, estimated fees and interest, and reported incidence of product use.
| Total estimated fees in billions | Household incidence | ||||
|---|---|---|---|---|---|
| Product | 2020 | 2021 | % change | 2020 | 2021 |
| Auto leases | $8.9 | $8.7 | -2% | 13% | 12% |
| Auto loans – BHPH | $9.0 | $8.7 | -3% | 3% | 4% |
| Auto loans – new | $26.7 | $29.9 | +12% | 19% | 19% |
| Auto loans – used | $53.0 | $55.6 | +5% | 24% | 23% |
| Credit cards – general purpose (revolving balance)29 | $106.0 | $95.0 | -10% | 55%ψ | 52%** ψ |
| Credit cards – private label (revolving balance) | $13.1 | $11.4 | -13% | 40%ψ | 39%ψ |
| Credit cards – secured | $0.3 | $0.3 | +3% | 5% | 6% |
| Installment loans30 | $26.6 | $26.2 | -2% | 12% | 9%* |
| Pawn loans31 | $6.9 | $6.9 | 0% | 4% | 4% |
| Payday loans | $2.9 | $2.5 | -15% | 5% | 3%* |
| Refund anticipation checks | $1.0 | $1.0 | 0% | 1% | 1% |
| Rent-to-own | $4.0 | $5.2 | +28% | 3% | 3% |
| Student loans – federal | $12.4 | $6.3 | -49% | 20% | 17%* |
| Student loans – private | $9.7 | $8.5 | -12% | 6% | 5% |
| Title loans | $2.8 | $2.3 | -19% | 2% | 2% |
| TOTAL | $283.5 | $268.4 | -5% | ||
* Statistically significant difference from 2020 incidence rate (p < 0.05).
** Statistically significant difference from 2020 incidence rate (p < 0.1).
ψ Among households holding general purpose or private label credit cards.
Appendix II, available in the PDF version of this report, lists financial services for which our methodology to calculate Estimated Fees and Interest has changed since our last published report. All 2020 data have been updated to align with the most recent methodology to make year-over-year comparison possible. Appendix II also lists the changes in survey questions used in calculating household incidence.
Payday, Pawn, and Title Loans
Alternative financial services, such as payday, pawn, and title loans, carry high APRs and are targeted at households who have few other credit alternatives. Many such services show sizable drops compared with before the pandemic, with some seeing further contractions between 2020 and 2021. Payday loans contracted an estimated 45% over two years, from $4.5 billion in 2019 to an estimated $2.5 billion in 2021. Meanwhile, pawn loans fell sharply between 2019 and 2020 (from $9.2 billion to $6.9 billion), and remained depressed in 2021 ($6.9 billion). Title loans have also seen contractions, both due to COVID-19 trends and the impact of state laws that restrict their use. These trends are presented below in Figure 8.
Trends in payday loans tracked closely with the disbursement of government aid, with dramatic drops in payday loan usage in April 2020, December 2020 to January 2021, and March 2021 that closely align with the timing of the three stimulus payments.32 Our survey found that reported usage of payday loans also dropped from 5% to 3%, with meaningful declines in the percentage of Black households reporting having used payday in the last year (from 10% to 6%). LMI households also reported lower incidence of payday loans (dropping from 7% in 2020 to 5% in 2021), as did Financially Vulnerable households (from 14% to 9%).
Figure 8. Many Alternative Credit Products Show Deep Drops
Compared with Pre-Pandemic (2019) Levels
Amount spent on various credit products, in billions
This suggests that direct payments, as a form of government assistance, allowed people to avoid higher-cost financial obligations. Given the high relative cost of alternative loan products for users, the stimulus and unemployment payments appear to have had an important positive impact on the financial situation of financially struggling households.
Still, demand for these products is driven by struggling households:
- Financially Vulnerable households were 28 times as likely to use pawn loans than Financially Healthy households (15% compared with 0.5%).
- Black households were more than twice as likely to use pawn loans than White households (7% compared with 3%).
- Fully 30% of pawn loan users in our survey reported that they had to forfeit an item due to their inability to repay.33
We estimate that the value of forfeited items makes up almost half of the pawn loan market revenue.
Credit Cards
Interest and fees for both general purpose and private label cards declined in 2021 as stimulus payments enabled some families to pay down credit card debt early in the year. Interest and fees on revolving balances for general purpose cards fell an estimated 10% (from $106 billion to $95 billion), while the interest and fees for revolving balances on private label cards fell from $13.1 billion to $11.4 billion. However, in the second half of the year, balances rose again; in fact, the fourth-quarter increase in balances was the largest on record, though balances are still below 2019 year-end totals.34, 35
In our survey, the percentage of revolvers, or cardholding households who reported carrying balances on general purpose credit cards, declined from 55% in 2020 to 52%** in 2021. This contraction was driven largely by LMI households and the Financially Coping. The percentage of revolver LMI households fell from 61% to 57%, while the percentage of revolver Coping households fell from 72% to 66%**. No significant changes were seen in revolvership among the Financially Healthy and Financially Vulnerable (29% and 86%, respectively). This stands in contrast to the patterns seen in alternative financial services, which saw the greatest change among Financially Vulnerable households.
Only about half of Black households (49%) in our survey report having general purpose credit cards, compared with three-fourths (74%) and four-fifths (88%) of Latinx and White households, respectively.36 However, Black households report revolving balances at higher rates.
** Statistically significant difference (p < 0.10).
The Rise of BNPL
There has been significant interest recently in the fast-growing buy now, pay later (BNPL) market, in which consumers can split a purchase into smaller installments, with the first installment due at checkout. BNPL has raised great interest from financial service providers and investors as well as concerns from regulators and consumer advocates. In March 2022 we released a BNPL data brief finding that BNPL is still a small fraction of the overall credit card market, with total interest and fees in the United States estimated at less than $1 billion. However, it is powered disproportionately by Financially Vulnerable consumers. For more details, see our report Buy Now, Pay Later: Implications for Financial Health.
Auto Loans
In 2021 auto prices rose significantly amid an inventory shortage and supply chain difficulties, leading to increases in average loan size and overall fees and interest.37, 38
Our survey found that the share of households with a used or new auto loan remained roughly flat in 2021.39 However, the share of White households and higher-income households with used auto loans in our survey dropped in 2021, aligning with Experian’s finding that prime consumers, who are more likely to be White and non-LMI, shifted away from used vehicles in 2021.40 These households may have gravitated toward new vehicles, given the financial bumps from stimulus checks as well as dealer and tax incentives.
Meanwhile, the subprime portion of total outstanding auto loan balances continued to shrink.41 This continual contraction of the subprime auto market could point to subprime consumers being priced out of the market or, more promisingly, could be attributed to the rising trend in consumer credit scores.42
Buy Here, Pay Here Loans
Buy here, pay here (BHPH) auto loans are also known as “no credit check loans.” Data on BHPH loans remains scarce, but this market appears to generate billions in interest from borrowers who lack strong credit, with total interest and fees estimated at $8.7 billion in 2021 – larger than all but a few of the products covered in this report.
Twelve percent of subprime borrowers reported turning to BHPH in 2021, up from 7% in 2020.43 Approximately 36% of BHPH borrowers default, with the cars often reclaimed by the lender.44
| BHPH average cash value45 | $6,400 | Estimated APR | 20% |
| Average amount financed46 | $12,200 | Average default rate | 36% |
Installment Loans
U.S. households spent an estimated $26.2 billion on installment loan products in 2021, a slight drop from $26.6 billion in 2020.47 This estimate includes loans originated by banks and credit unions as well as those from online-only lenders and finance companies.
Installment loans look very different depending on the lender and the consumer’s profile. Based on both survey data and an analysis of publicly reported credit bureau data, we estimate that the average interest rate for prime credit installment borrowers was 13% in 2021, with such loans more likely to come from a bank or a credit union. Subprime consumers, meanwhile, were more likely to use nonbank lending options and paid an average interest rate of 27%.48 In fact, subprime consumers were more than twice as likely (7% compared with 3%) to have taken out a nonbank installment loan than their prime credit counterparts. We see similar patterns by financial health status: Financially Vulnerable households were almost three times more likely to use nonbank installment loans than their Financially Healthy peers.
Student Loans
Marking a dramatic shift from before the pandemic, interest and fees on private student loans exceeded those from federal student loans in 2021, although federal student loans comprise 92% of the $1.7 trillion student loan portfolio.49
Estimated interest and fees on federal student loan totals fell precipitously from $25 billion in 2019 to $6.3 billion in 2021, due to the student loan moratorium in place since March 2020. Payments during this period either were made voluntarily or applied to a portion of federal loans originated under the Federal Family Education Loan (FFEL) Program.50 Private student loans, which were not subject to the moratorium, saw a much more muted change compared with before the pandemic. (See Figure 9.)
As of this publication, the federal student loan moratorium is set to expire after August 31, 2022. We estimate that, before the pandemic, federal Direct Loan borrowers paid $1.5 billion more in interest each month on average; any extension of the moratorium would thus free this sum – not to mention the principal – for spending on other needs.51
Figure 9. Estimated Interest and Fees from Student Loans by Type, 2019-21, in Billions
Insurance
Insurance products manage risk by safeguarding against loss. We present these products separately because they do not follow the interest and fee revenue structure of other product categories. Instead, consumers pay recurring premiums for insurance coverage, with cost based on the type of insurance policy, amount of coverage, and the consumer’s risk profile. Table 3 below includes estimated premiums and incidence of insurance product use for 2020 and 2021.
Table 3. Insurance, estimated premiums, and reported incidence of product use.
| Total estimated premiums in billions | Household incidence | ||||
|---|---|---|---|---|---|
| Product | 2020 | 2021 | % change | 2020 | 2021 |
| Auto insurance | $242.8 | $244.5 | +1% | 98%ψ | 98%ψ |
| Homeowners insurance | $84.8 | $90.4 | +7% | 91%ψ | 91%ψ |
| Individual life insurance | $148.0 | $161.3 | +9% | 38% | 42%* |
| Renters insurance | $3.3 | $3.3 | +1% | 45%ψ | 45%ψ |
| TOTAL | $478.9 | $499.7 | +4% | ||
* Statistically significant difference in incidence rate vs. 2020 (p < 0.05).
ψ Household incidence represents the proportion of households reporting said insurance among auto owners (for auto insurance), homeowners (for homeowners insurance), and renters (for renters insurance). Life insurance reflects proportion of households reporting individually purchased life insurance policies.
Appendix II, available in the PDF version of this report, lists financial services for which our methodology of calculating estimated premiums has changed since our last published report. All 2020 data have been updated to align with the most recent methodology to make year-over-year comparison possible. Appendix II also lists the changes in survey questions used in calculating household incidence.
Within the insurance category, homeowners insurance and life insurance saw the largest growth in total premiums in 2021.
Individual life insurance continued the upward trajectory it began at the start of the pandemic, with premiums growing a further 9% in 2021 to an estimated $161.3 billion. In fact, industry group LIMRA reported that life insurance growth in the first half of 2021 was the largest in almost 40 years.52 Accordingly, our survey also found a jump in households with individual life insurance, with overall incidence growing 4 percentage points to 42% of all households.
Growth occurred across most populations studied, including White households (up 5 percentage points), Black households (up 8 percentage points), and both LMI and non-LMI households (5 and 4 percentage points, respectively). Despite this jump, Black and Latinx households were respectively 6% and 5% less likely than White households to have a group life insurance policy through their employers.
Meanwhile, despite the surge in homebuying over the last few years and accompanying growth of homeowners insurance, stark disparities remain in both home and insurance ownership.53 Two-thirds of survey respondents reported owning their home, and 91% of owners said they held homeowners insurance. Financially Healthy households were far more likely to own their homes than financially struggling households. Conversely, renters – who were much more likely to be Financially Vulnerable – reported far more limited usage of renters insurance: 45% of renters reported having renters insurance, holding steady from 2020.
From Pandemic Disruption Toward Familiar Patterns
The COVID-19 pandemic has upended people’s lives in countless ways, with successive variants requiring Americans to continually recalibrate their lives and their finances. In 2021 this meant a rare drop in overall spending on financial services.
Yet, as the year came to a close, several financial services began to trend back toward normal patterns, with credit card and installment balances on the rise. Other products are poised to see a jump in 2022: The student loan moratorium is slated to end after August, meaning millions of borrowers will need to readjust their budgets to resume regular payments. Families facing cash-flow crunches and limited options for credit may indeed return to payday and pawn loans. 2022, therefore, may see a quick return to pre-pandemic levels of consumer spending.
Our analysis adds to the understanding of how households have managed their finances through the pandemic. It also lends insight into the deep, unwavering disparities in our country that impact people’s ability to access high-quality, affordable financial services – especially across race, ethnicity, and income.
This report provides a tool for financial services providers, researchers, policymakers, and advocates to better understand trends in consumer spending and identify opportunities to support more equitable financial health policies and products. We continually strive to enhance our analyses and encourage engagement from readers to better understand how our work can support policy and product developments that contribute to financial health. We also welcome outreach from policymakers, researchers, and others who are interested in exploring our dataset in greater detail.
Acknowledgments
This report would not have been possible without the insights and contributions of many.
We are particularly grateful for the strategic guidance and insights of our colleagues Rob Levy and David Silberman, as well as the support of Stephen Arves. We also thank the following current and former Financial Health Network staff for their product insights and narrative support: Naomi Adams Bata, Beth Brockland, Andrew Dunn, Thea Garon, Heidi Johnson, Devina Khanna, Tanya Ladha, Dan Miller, Dan Murphy, Sarah Parker, Brenton Peck, Garry Reeder, Corey Stone, John Thompson, and Marisa Walster. In addition, Arjan Schütte from Core Innovation Capital provided valuable insights.
The report benefited from the review of Carolina Souza from Prudential Financial.
We are grateful to the wide range of experts from the following organizations who shared with us their unique insights into market trends, including the Student Borrower Protection Center, Aite-Novarica Group, Mercator Advisory Group, the Consumer Financial Protection Bureau (CFPB), the Center for Responsible Lending, Navient, Experian, RiteCheck, the Nationwide Multistate Licensing System & Registry, and more.
Marco Angrisani, Jill Darling, Tania Gutsche, and Bart Orriens from the University of Southern California Dornsife Center for Economic and Social Research provided valuable input throughout this project.
This report is made possible through the financial support of Prudential Financial.
![]()
FinHealth Spend Report 2022
For definitions, data tables, and methodology details, see Appendices in the PDF version.
- The 2021 FinHealth Spend Report reported $303 billion in interest and fees for 2020. However, several of our estimates have been updated given new data availability, and the product mix has been adjusted. $319 billion is our updated 2020 estimate for all products for which we have both 2020 and 2021 estimates.
- Elan Amir, Jared Teslow, & Christopher Borders, “The MeasureOne Private Student Loan Report,” MeasureOne, June 2021.
- Estimated using monthly average for 2019 federal Direct Loan and FFELP interest payments.
- “Quarterly Report on Household Debt and Credit: 2021 Q4,” Federal Reserve Bank of New York, February 2022.
- “Update: COVID-19 Impact Study on Small-Dollar Lending,” Veritec Solutions, June 2021.
- Melinda Zabritski, “Auto Finance Insights: State of the Automotive Finance Market Q3 2021,” Experian, December 2021.
- “Buy-Here, Pay-Here Trends Market Perspectives 2020,” National Alliance of Buy Here, Pay Here Dealers (“NABD”) and Subprime Analytics, 2020.
- Installment loans are also referred to as personal loans, unsecured personal loans, or unsecured installment loans.
- These subprime and prime average APRs were calculated by mapping Bankrate April 2021 interest rates by credit tier to TransUnion volume by credit tier. The subprime APR is the weighted average of near prime and subprime APRs. The prime rate is the weighted average of prime, prime plus, and super prime APRs. Both calculations use the share of balances by credit tier for the weighted average.
- “10-K SEC Filing,” World Acceptance Corp, March 2021.
- “LIMRA: First Half of 2021 Had Highest U.S. Life Insurance Policy Sales Growth Since 1983,” LIMRA, September 2021.
- Anna Bahney, “The housing market was on a wild ride this year. Here’s what to expect in 2022,” CNN Business, December 2021.
- The 2021 FinHealth Spend Report reported $303 billion in interest and fees for 2020. However, several of our estimates have been updated given new data availability, and the product mix has been adjusted. $319 billion is our updated 2020 estimate for all products for which we have both 2020 and 2021 estimates.
- We do not directly compare changes in percentage of household income spent by population from 2020 to 2021. First, the composition of products and 2020 estimates have changed since our last report. Additionally, our national product spending estimates are based on secondary research, and significance testing is not possible. We have examined demographics of survey respondents year over year and did not see significant differences in the percentage of the sample by race, ethnicity, income, or financial health.
- We follow Housing and Urban Development’s (HUD) definition of low- and moderate-income households, which takes into account variability in cost of living. However, HUD uses area median family incomes for determining eligibility for certain public housing assistance programs. Given that the unit of analysis in our survey is a household (which differs from a family as the census defines it), we use area median household incomes instead. According to this definition, a household that has income below 50% of area household median income (AMI) is considered low-income, whereas a household that has income from 51% to below 80% of AMI is considered moderate-income. For most households, the area is a census tract. For some households, the area is the state of residence because of a lack of detailed geographic information.
- Spending per household is calculated by the total spending per financial health tier divided by the number of households in that segment nationwide. The percentage of income is the average household income (using midrange points of categorical income variable) per segment divided by the spending per household in that segment.
- In the 2021 survey, we asked about incidence of overdraft among both households with checking accounts and those who had recently closed their account. In the 2020 survey, the question was only asked of those with open accounts.
- The estimate for prepaid cards includes fees across three subcategories: general-purpose reloadable cards, payroll cards, and government benefits cards.
- The Consumer Financial Protection Bureau (CFPB) calls this “NSF/overdraft ‘reliance’” and estimates that it comprised 66.5% in 2019 and 62.4% in 2020. Éva Nagypál, “Data Point: Overdraft/NSF Fee Reliance Since 2015 – Evidence from Bank Call Reports,” Consumer Financial Protection Bureau, December 2021.
- While overdraft totals for 2020 and 2021 are similar, they display different seasonal patterns. Overdraft declined sharply in Q2 at the start of the pandemic. 2021 followed the more normal pattern of a decline in Q1 followed by increases over the rest of the year, still ending at a lower point than Q4 2019.
- While Black and Latinx households report greater incidence of any overdrafts than White households, we did not find a statistically significant difference in the number of overdrafts reported by race/ethnicity among households with bank accounts.
- Brink’s indicated that in 2021, ATM transactions rebounded more than 30% over 2020 levels. “Cash Usage,” Brink’s.
- Alicia Adamcyzk, “Big banks are slashing overdraft fees—here’s how to avoid them altogether,” CNBC, January 2022.
- Ken Sweet, “Banks slowly reconsider overdraft fees, amid public pressure,” ABC News, December 2021.
- Dilip Ratha, Eung Ju Kim, Sonia Plaza, Ganesh Seshan, Elliott J Riordan, & Vandana Chandra, “Migration and Development Brief 35: Recovery: COVID-19 Crisis Through a Migration Lens,” KNOMAD & World Bank Group, November 2021.
- “Report to Congress, Government-Administered, General-Use Prepaid Cards,” Board of Governors of the Federal Reserve System, October 2021.
- Devina Khanna and Arjun Kaushal, “Earned Wage Access and Direct-to-Consumer Advance Usage Trends,” Financial Health Network, April 2021.
- Among low-wage workers, 13% have access to EWA products, according to a forthcoming report by the Financial Health Network.
- Credit card totals include interest on revolving balances as well as annual fees, transactional fees, and penalty fees for account holders with revolving balances.
- Installment loans now include both loans issued by banks and nonbanks, whereas in the 2021 FinHealth Spend Report, it was only nonbanks.
- Pawn loans include both the cost of the loan as well as revenue from forfeited loan collateral.
- “Update: COVID-19 Impact Study on Small-Dollar Lending,” Veritec Solutions, June 2021.
- Our estimate of pawn loan item forfeitures due to inability to pay (30%) was much higher than other industry estimates (15%). Emily Stewart, “It’s easy to assume pawnshops are doing great in the pandemic. It’s also wrong,” Vox, November 2020.
- “U.S. National Consumer Credit Trends Report: Portfolio,” Equifax, October 2021.
- “Quarterly Report on Household Debt and Credit: 2021 Q4,” Federal Reserve Bank of New York, February 2022.
- The FDIC How America Banks study found similar rates of credit card ownership for Black and White households but somewhat lower figures for Latinx households.
- Andrew Haughwout, Donghoon Lee, Daniel Mangrum, Joelle Scally, & Wilbert van der Klaauw, “Car Prices Drive Up Borrowing,” Federal Reserve Bank of New York, Liberty Street Economics, February 2022.
- “New data shows delinquencies remain low amid rising average vehicle loan amounts,” Experian, December 2021.
- The Q4 2021 Quarterly Report on Household Debt and Credit shows a slight decline in the number of auto loan holders over 2021. “Quarterly Report on Household Debt and Credit,” Federal Reserve Bank of New York, February 2022.
- Melinda Zabritski, “Auto Finance Insights: State of the Automotive Finance Market Q3 2021,” Experian, 2021.
- Ibid.
- Stefani Wendel, “State of Credit 2021: Rise in scores despite pandemic challenges,” Experian, September 2021.
- Credit tiers were mapped according to survey responses to the question “How would you rate your credit score?” Responses of “Fair,” “Poor,” “I don’t have a credit score,” and “Don’t know” were mapped to Subprime.
- “Buy-Here, Pay-Here Trends Market Perspectives 2020,” National Alliance of Buy Here, Pay Here Dealers (“NABD”) and Subprime Analytics,” 2020.
- Ibid. Actual cash value (ACV) is the wholesale value of a car assigned by a dealer, adjusted for depreciation and expected reconditioning costs.
- Ibid.
- Our survey found that the number of households reporting holding installment loans dropped from 2020 to 2021, driven by a decrease in reported loans from banks or credit unions. However, credit bureaus such as Experian found that the number of personal loans increased over a similar period. This discrepancy may be due to question wording, respondent error, or the overlap between definitions (and consumer understanding of) installment loans and several other credit products.
- These subprime and prime average APRs were calculated by mapping Bankrate April 2021 interest rates by credit tier to TransUnion volume by credit tier. The subprime APR is the weighted average of near prime and subprime APRs. The prime rate is the weighted average of prime, prime plus, and super prime APRs. Both calculations use the share of balances by credit tier for the weighted average.
- Elan Amir, Jared Teslow, & Christopher Borders, “The MeasureOne Private Student Loan Report,” MeasureOne, December 2021.
- Federal loans under the Federal Family Education Loan (FFEL) Program, which ended in 2010, are either commercially owned or owned by the U.S. Department of Education. The commercially owned portion of FFEL loans was exempt from the CARES Act student loan moratorium.
- Estimated using monthly average for 2019 federal Direct Loan and FFELP interest payments.
- “LIMRA: First Half of 2021 Had Highest U.S. Life Insurance Policy Sales Growth Since 1983,” LIMRA, September 2021.
- “Summary of December 2021 Existing Home Sales Statistics,” National Association of Realtors, January 2022.