FinHealth Spend 2025: The Cost of Financial Services For American Households

How Much Do Americans Spend on Financial Services?
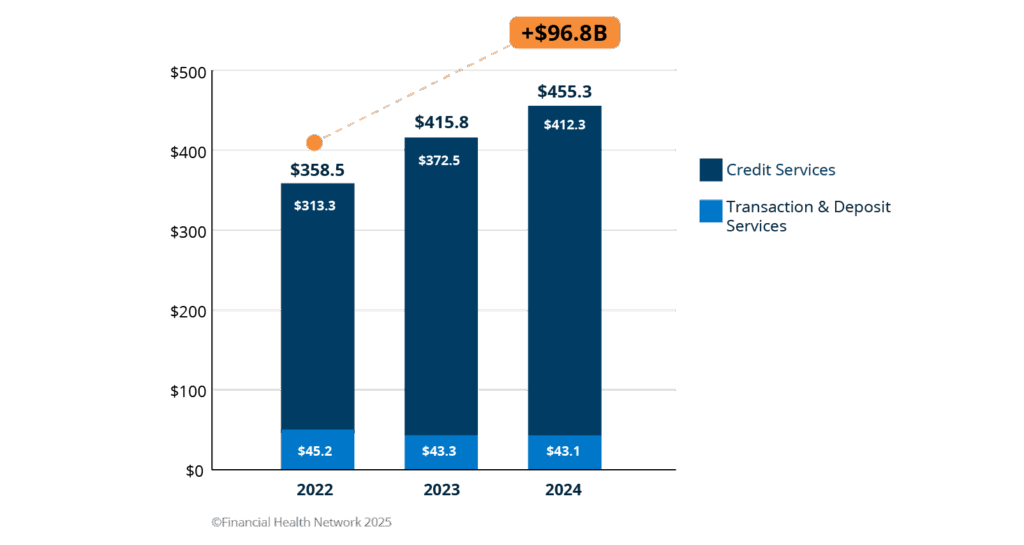
In 2024, U.S. households spent an estimated $455 billion on financial services fees and interest, nearly $100 billion more than in 2022. Rising credit card balances and the return of student loan payments drove much of this increase, while overdraft fees ticked upward for the first time in years.
Disparities in financial services fees and interest also continued in 2024, with vulnerable populations – including households who are not Financially Healthy, Black and Latine households, and households without prime credit scores – bearing the brunt of these burdens. At the same time, new data reveal shifts in bank account ownership and what it means to be “unbanked.” Together, these trends underscore how growing costs and persistent inequities continue to shape financial health across America.
Consumer spending on financial services fees and interest has jumped nearly $100 billion since 2022.
Total estimated spending on interest and fees, in billions, 2022-2024.
Financial Health and Racial Disparities in Fees and Interest
-
- For Financially Vulnerable households, spending on fees and interest alone made up 17% of their income, compared with just 1% among Financially Healthy households.
- Black households spent twice as much of their income on financial services as white households (8% vs. 4%).
- Households with subprime credit contributed 14% of household income toward fees and interest for financial services, compared with 2% among households with prime credit.
Key Findings on Financial Services Fees and Interest: 2024
-
- Debt manageability is declining for some households. Only 57% of households carrying credit card debt month to month reported their debt is manageable in 2024, down from 67% in 2020.
- Credit products continue to drive growth in estimated spending, led by credit card debt and student loans.
- Estimated spending on fees and interest for federal student loans more than doubled year-over-year, rising to an estimated $31 billion in 2024. Almost one quarter of borrowers in active repayment reported struggling to make payments.
- More than half of U.S. households hold multiple checking accounts, often across different institutions.
Credit Card Debt Remains the Biggest Driver of Household Spending on Fees and Interest
In 2024, Americans paid an estimated $165.1 billion in fees and interest on revolving general purpose credit card balances. Year-over-year growth in credit spending slowed as the growth in average credit card interest rate moderated, with interest and fees rising 10% in 2024 compared with 25% in 2023. Still, rising total outstanding balances and delinquencies indicate that credit card debt became harder to manage for many families, with vulnerable households significantly more likely to report incurring late fees. As balances have continued to grow over the past five years, households who carry credit card debt have reported less confidence in managing their overall household debt – underscoring growing strain among some borrowers.
Manageability of debt has declined among households with revolving credit card debt.
Total estimated spending on interest and fees, in billions, 2022-2024.
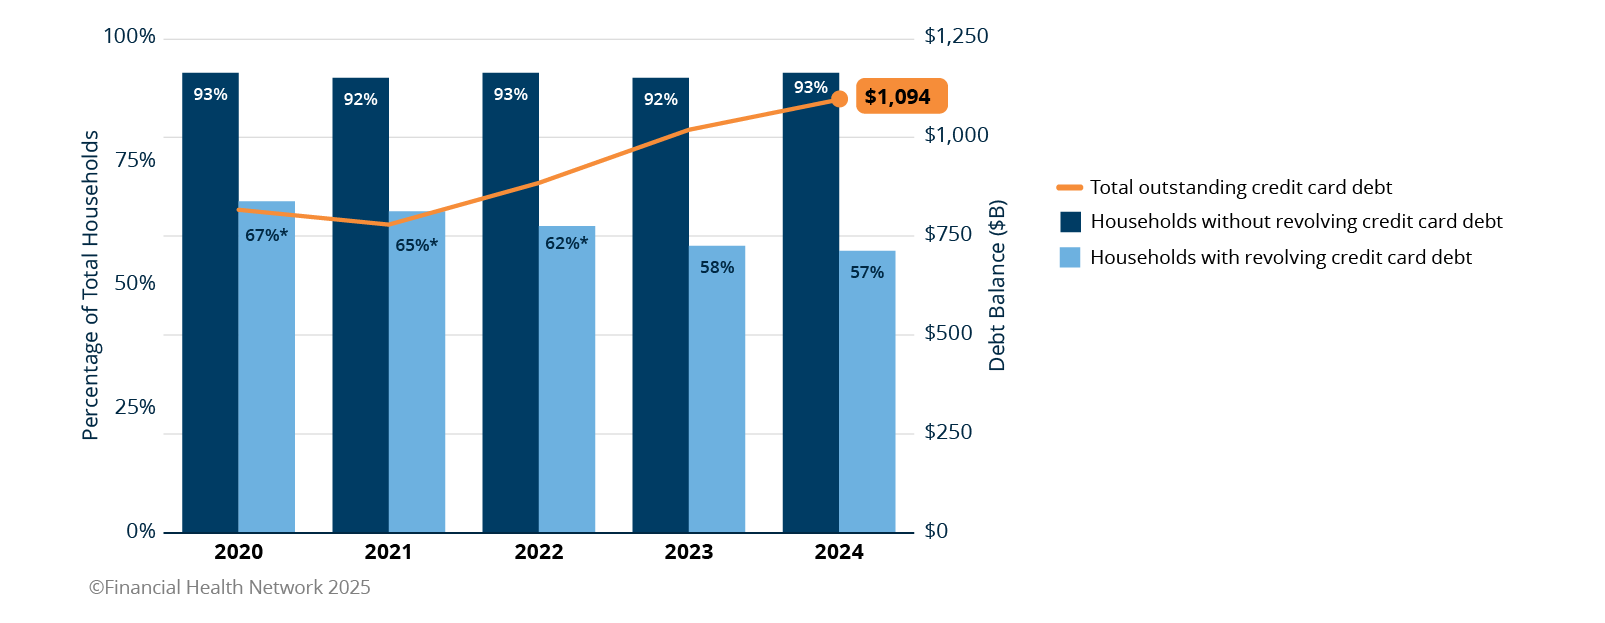
Notes: Bar chart (left axis) shows the percentage of cardholder households who reported they “have a manageable amount of debt” or “do not have any debt” over time. Households with revolving credit card debt are those who carried a balance for at least one month of the year on general purpose or private label credit cards (N = 1,673 in 2020, N = 2,024 in 2021, N = 2,006 in 2022, N = 2,150 in 2023, and N = 1,933 in 2024), and those without are households who did not carry a balance (N = 1,523 in 2020, N = 2,057 in 2021, N = 2,149 in 2022, N = 2,413 in 2023, and N = 2,308 in 2024). Line graph (right axis) represents total outstanding credit card debt: the sum of average annual balances for general purpose bank cards and private label cards. Balances are reported monthly in Equifax’s Monthly National Consumer Credit Reports and averaged across 12 months for each year. * Statistically significant relative to 2024 (p < 0.05).
Credit Card Debt Statistics for 2024
-
- Total fees and interest on general purpose card balances rose to an estimated $165.1 billion in 2024, up 10% from 2023.
- Meanwhile, estimated spending on fees and interest for private label cards held relatively steady at $15.4 billion, essentially unchanged from 2023.
- Overall, fees paid by households who carried a balance on general purpose cards were estimated at $25.8 billion, or 16% of fees and interest combined.
- Disparities were stark: 49% of Financially Vulnerable households paid a late fee, compared with 3% of Financially Healthy households.
- Black (20%) and Latine (16%) cardholders reported higher late fee incidence than white households (9%).
- Only 57% of households with revolving credit card debt reported their debt was manageable in 2024, down from 67% in 2020.
- Total fees and interest on general purpose card balances rose to an estimated $165.1 billion in 2024, up 10% from 2023.
Transaction and Deposit Services: Persistent Costs, Shifting Behaviors
In 2024, households spent an estimated $43.1 billion on transaction and deposit fees – essentially flat compared with 2023. Despite this stability, some fee pressures persist, with overdraft fees rising slightly for the first time in several years. The data also indicate substantial account fragmentation, as many households hold multiple checking accounts across institutions, reflecting the growing complexity of household banking relationships.
Estimated deposit account fees (from account maintenance, ATM, and overdraft/NSF) were flat in 2024.
Estimated fees in billions, by type and year.
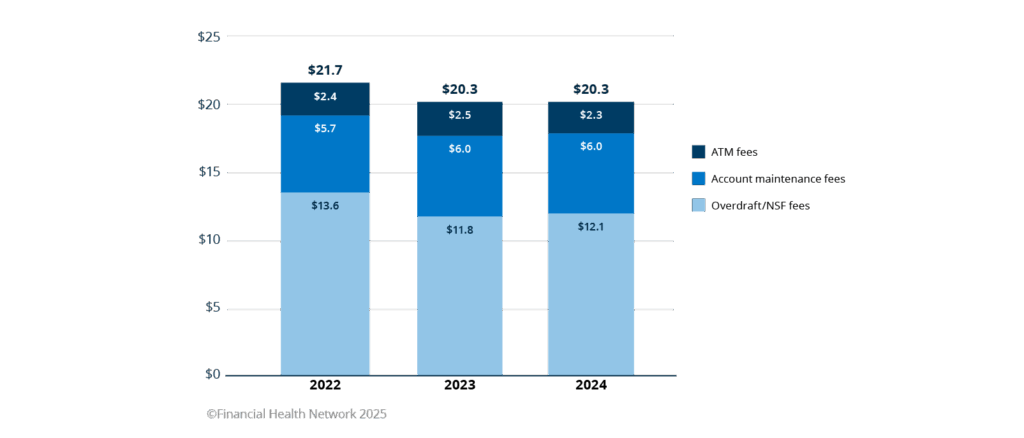
Notes: Estimates include fee revenue for banks and credit unions. The above categories do not represent a comprehensive list of all possible fees associated with deposit accounts, but reflect those detailed in the Federal Financial Institutions Examination Council (FFIEC) Call Reports.
Overdraft and Banking Statistics for 2024
-
- Overdraft/NSF fees rose slightly to an estimated $12.1 billion, ending a multi-year decline.
- Credit union overdrafters reported higher frequency of fees than bank overdrafters.
- Fragmentation in checking accounts: 55% of banked households hold multiple checking accounts, and roughly 1 in 5 span different types of institutions.
- Among “unbanked” households (5% of households), nearly 1 in 4 actually use online-only banks – raising questions about what it really means to be “unbanked” today.
- Overdraft/NSF fees rose slightly to an estimated $12.1 billion, ending a multi-year decline.
Student Loans in 2024: Fees and Interest Double, Borrowers Struggle
Estimated student loan spending rose sharply in 2024, following the end of pandemic-era forbearance programs. For the first time in years, many borrower households faced a full calendar year of payments, and fees and interest on federal student loans more than doubled to an estimated $30.6 billion, surpassing pre-pandemic levels.
Fees and interest for federal and private student loans surpassed pre-pandemic levels in 2024.
Estimated fees and interest on federal and private student loans, by year, in billions.
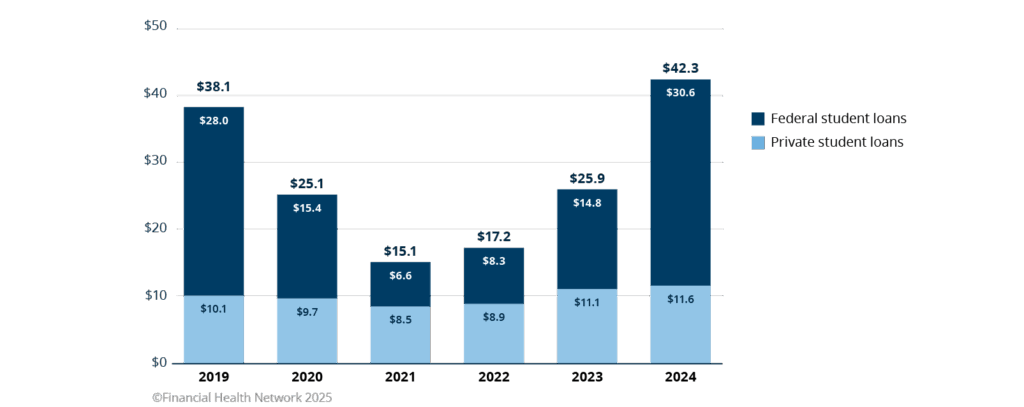
Notes: Fee and interest estimates reflect the calendar year, not the federal government’s fiscal year.
Student Loan Repayment Challenges in 2024
-
- Households spent an estimated $30.6 billion in fees and interest on federal student loans in 2024, more than double 2023 levels.
- Estimated spending on federal student loans exceeded pre-pandemic highs, marking a five-fold increase from the 2021 low.
- 37% of households currently making student loan payments reported repayment challenges – from missed or late payments to forgoing essentials to stay current.
- These challenges were most acute among Black households, lower-income families, and subprime borrowers.
Buy Now, Pay Later (BNPL): Loan Stacking and Affordability Concerns
While the overall share of households using buy now, pay later (BNPL) loans remained steady in 2024, households reported taking out more loans than in the past. Sixty percent of BNPL users reported taking out three or more loans in 2024, compared with 53% in 2023 and 51% in 2022.
A persistent question about BNPL has been whether users are “stacking” multiple, concurrent loans from different institutions – a practice that may expose borrowers to unmanageable levels of debt and lenders to greater risk. One-third of BNPL users reported having taken loans multiple times in the past month, signaling overlapping payments. Among that group, 41% said their loans came from more than one provider.
The reported number of annual BNPL uses is growing.
Number of BNPL purchases in the last 12 months, among those with at least 1 BNPL purchase.
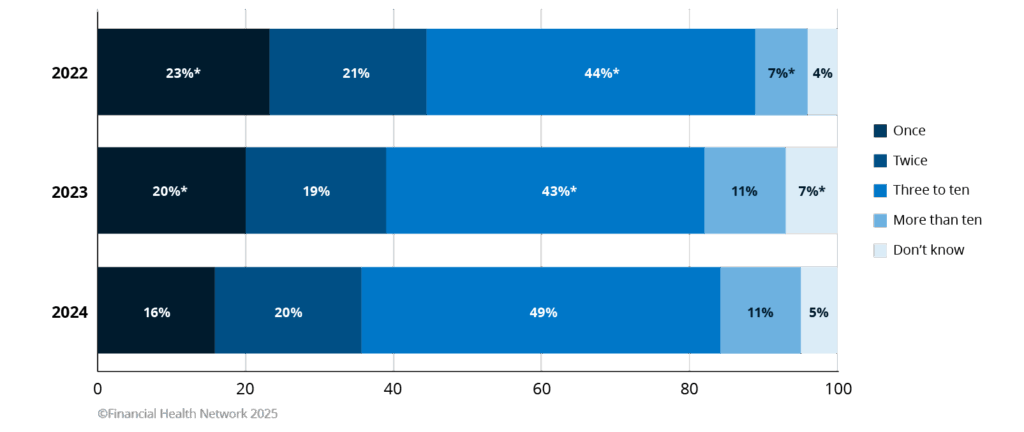
Notes: Among households with at least one BNPL purchase in the past year (N = 642 in 2022, N = 862 in 2023, and N = 724 in 2024). * Statistically significant relative to 2024 (p < 0.05).
Buy Now, Pay Later Trends for 2024
-
- 16% of households reported using BNPL loans in 2024, essentially unchanged from the 17% of households who reported using this service in 2023.
- Among BNPL users, 60% reported taking out three or more loans – up from 53% in 2023.
- Of those with multiple loans in the past month, 41% borrowed from more than one provider – suggesting “stacking” is taking place.
- Reported spending challenges increased, with more BNPL users reporting difficulty affording payments.
- The share of users reporting no issues declined from 61% in 2023 to 55% in 2024, a significant decline.