Financial Health Pulse® 2025 Chicago Trends Report

Figure 3. Share of Financially Healthy and Vulnerable households by Chicago region, 2025.
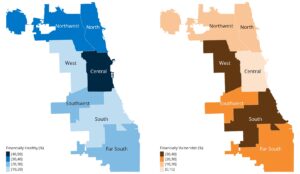
Source: Chicago Financial Health Pulse Survey
Note: Sample sizes are N = 1,127 (North), N = 975 (Central), N = 669 (Northwest), N = 460 (West), N = 994 (South), N =426 (Far South), N = 255 (Southwest).
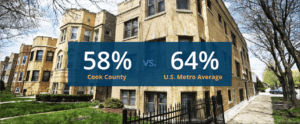
4. Homeownership continued to lag behind national benchmarks.
-
- 58% of Cook County households own their homes, compared to 64% of households on average across U.S. metro areas.
- Only half (51%) of renters who would like to own a home thought they were likely to become homeowners in the next five years.
- Not having sufficient financial resources and affordability were key obstacles to homeownership. Nearly three-quarters (70%) of renters who would find it difficult to buy a home today could not afford a down payment, and half (50%) thought there were not enough affordable homes, they had insufficient income, or found interest rates high.
- 6 in 10 Cook County households reported having positive net worth, with lower rates in the city of Chicago than in the suburbs. Nearly one-fifth of Chicago households reported negative net worth, meaning they owed more than they owned.
- Findings on household net worth underscored persistent racial and ethnic wealth disparities in Cook County. Fewer than half of Black (47%) and Latino (49%) households reported having positive net worth, compared with 77% of white and 67% of Asian households. Black and Latino households were also more likely to report negative net worth.
Related Research

Financial Health Pulse® 2022 Chicago Report
In our first report to focus on the Financial Health Network’s home city, we explore the realities of the financial lives of people in Chicago and neighboring Cook County suburbs.

Hawaii Financial Health Pulse: 2019 Survey Results
The majority of Americans are struggling financially – and the everyday economic reality is similar for those who live and work in Hawaii. The Hawaii Financial Health Pulse offers an in-depth view of their financial struggles and coping strategies, along with potential solutions to improve financial health across Hawaii and the rest of the country.
Acknowledgements
The Financial Health Pulse Chicago Trends Report is supported by The Chicago Community Trust and JPMorganChase. The findings, interpretations, and conclusions expressed in this piece are those of the Financial Health Network and do not necessarily represent those of our funders or partners.