Financial Characteristics
Use the drop down menu to compare financial health differences across various financial characteristics in 2025.
Figure 10. Income was positively associated with financial health.
2025 percentages in each financial health tier, by household income as a percentage of AMI.
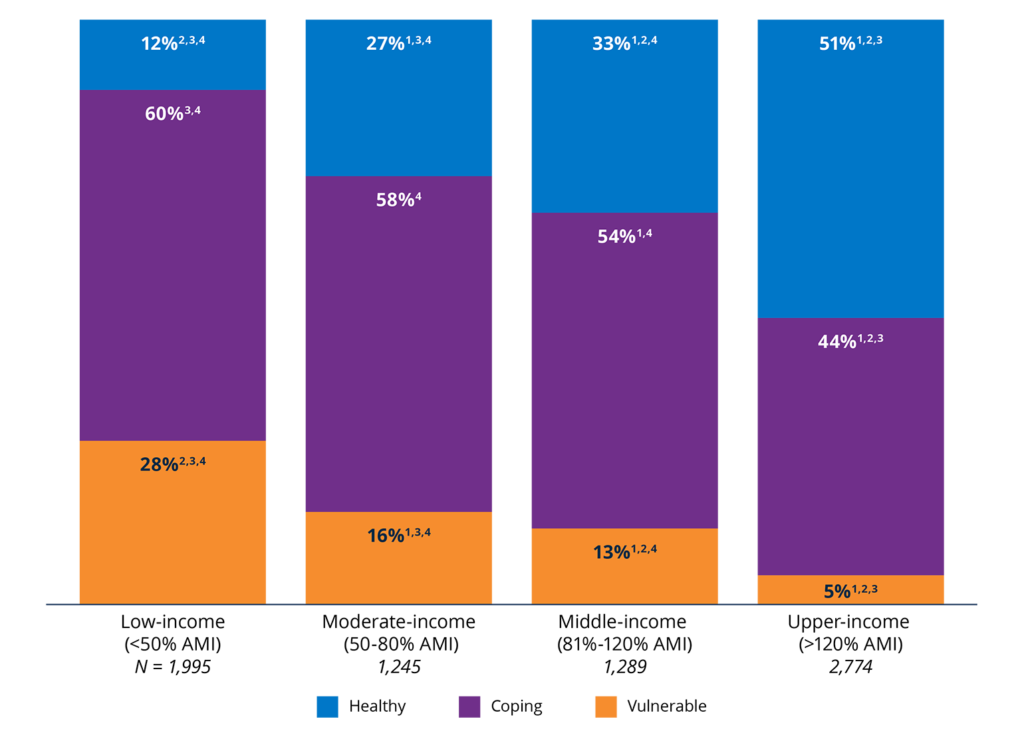
Notes: AMI is defined as the median household income for that respondent’s Metropolitan Statistical Area (MSA), or county if the respondent does not live in an MSA. In 2025, 121 respondents had missing income or geographic information. Percentages may not sum to 100% due to rounding.
1 Statistically significant relative to low income (p < .05).
2 Statistically significant relative to moderate income (p < .05).
3 Statistically significant relative to middle income (p < .05).
4 Statistically significant relative to upper income (p < .05).
Figure 12. Nearly half of households with positive net worth are Financially Healthy, compared with just 3% of those with negative net worth.
2025 percentages in each financial health tier, by net worth.
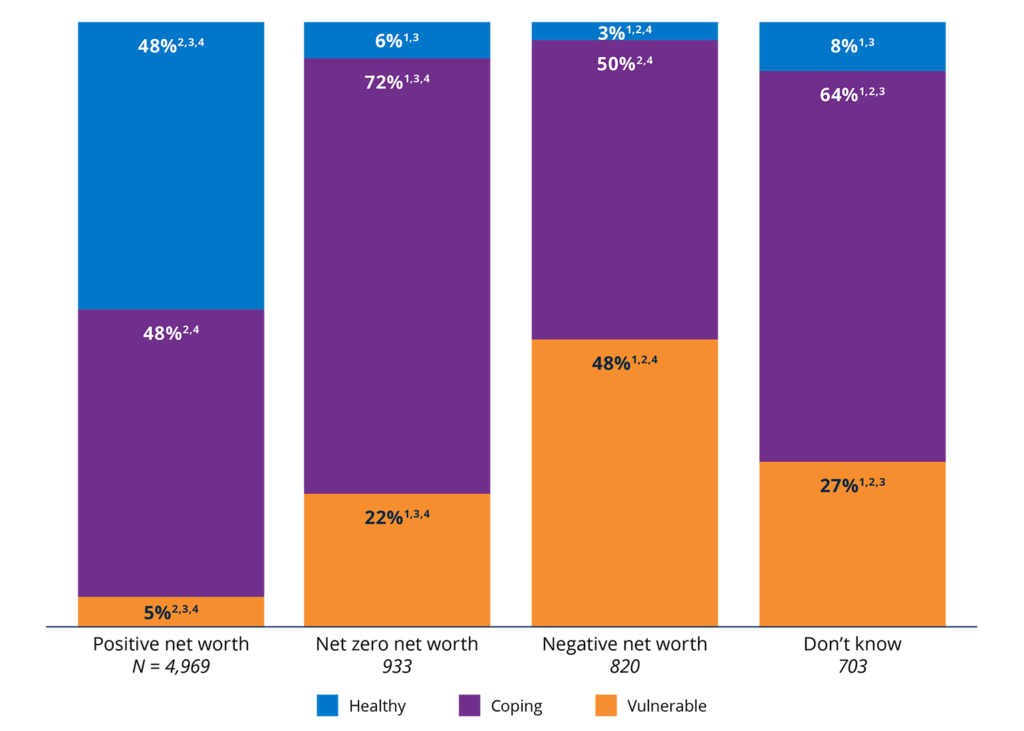
Notes: Categories are based on respondents reporting that after selling all their assets to pay all of their debts, they would have money left over, roughly break even, or would be in debt. See Appendix B for exact question wording. Two respondents had missing net worth. Percentages may not sum to 100% due to rounding.
1 Statistically significant relative to positive net worth (p < .05).
2 Statistically significant relative to net zero net worth (p < .05).
3 Statistically significant relative to negative net worth (p < .05).
4 Statistically significant relative to “don’t know” (p < .05).
Figure 14. Households without revolving credit card debt were more likely to be Financially Healthy.
2025 percentages in each financial health tier, by revolving credit card debt ownership.
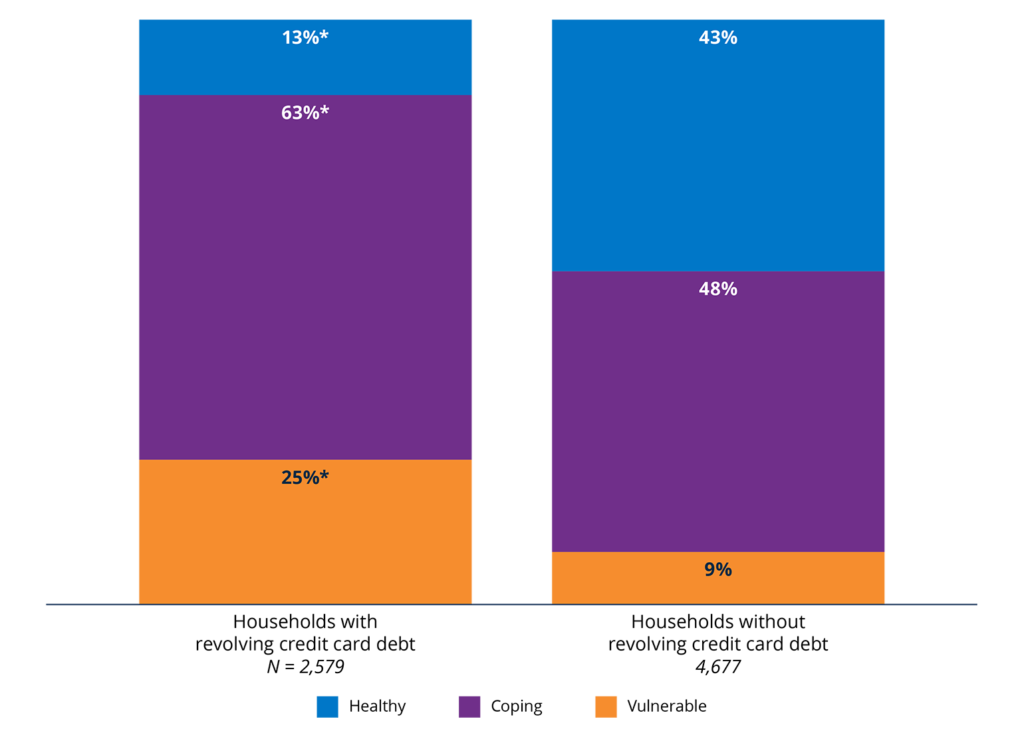
Notes: In 2025, 163 respondents responded “I don’t know” and seven skipped the question. Percentages may not sum to 100% due to rounding.
* Statistically significant relative to households without credit card debt (p < .05).
Figure 16. Households with investments were more likely to be Financially Healthy.
2025 percentages in each financial health tier, by investment ownership.
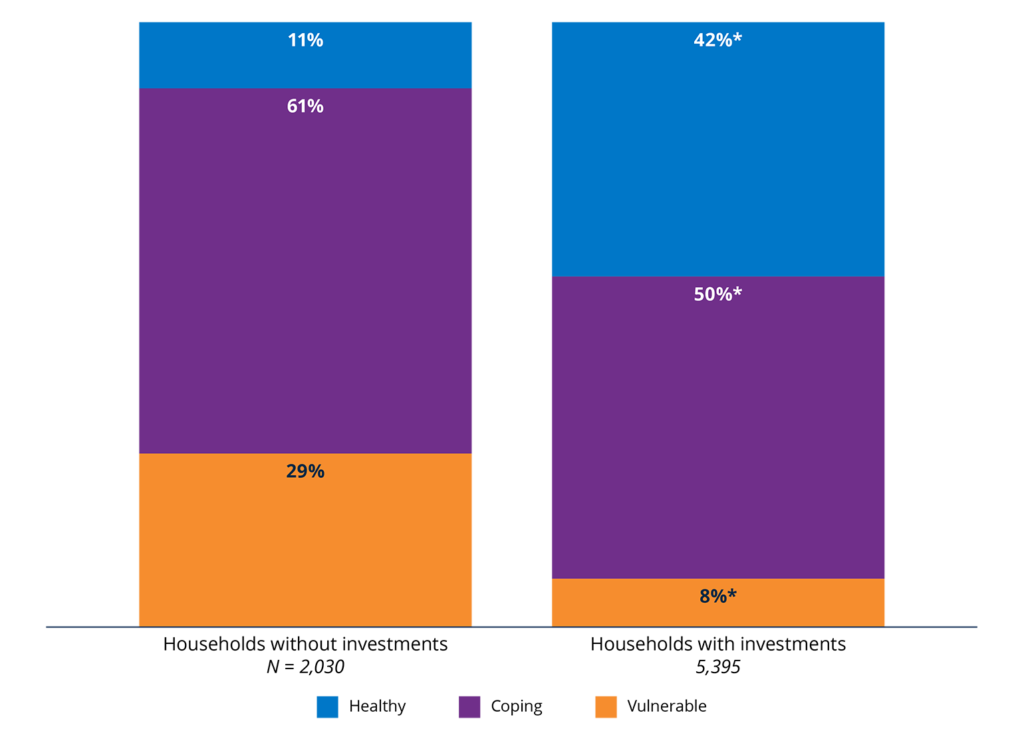
Notes: Investor households are defined as those with any retirement accounts or non-retirement investment accounts. For a detailed definition, see Appendix B. Two respondents in 2025 had a missing investor status. Percentages may not sum to 100% due to rounding.
* Statistically significant relative to households without investments (p < .05).
Figure 18. Households without student loans were more likely to be Financially Healthy.
2025 percentages in each financial health tier, by student loan ownership.
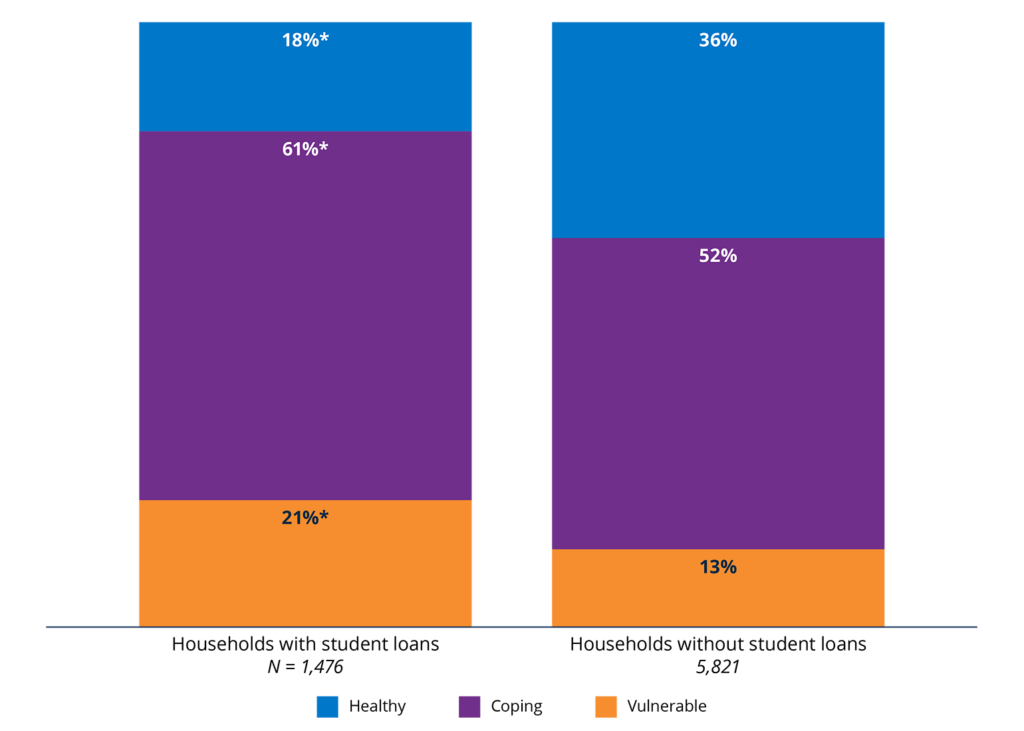
Notes: In 2025, 120 respondents reported not knowing whether their household had student loans, and nine respondents skipped the question. Percentages may not sum to 100% due to rounding.
* Statistically significant relative to households without student loans (p < .05).
Figure 20. Homeowners were more likely to be Financially Healthy than renters.
2025 percentages in each financial health tier, by housing tenure.
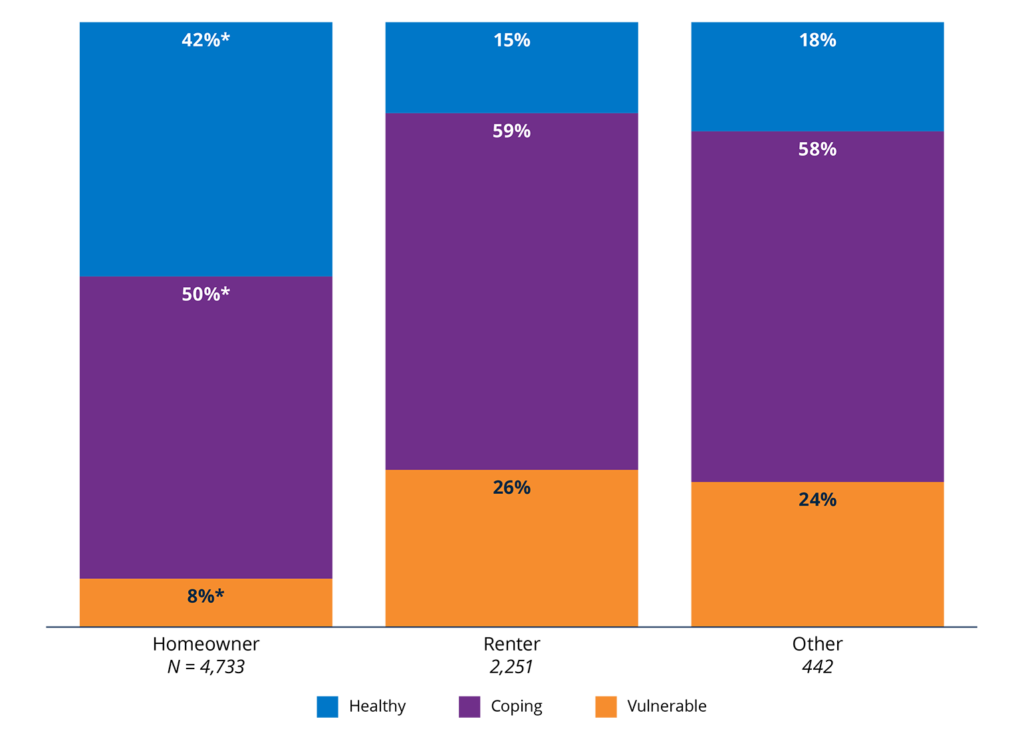
Notes: One respondent had a missing housing tenure. Percentages may not sum to 100% due to rounding.
* Statistically significant relative to renters (p < .05).
Figure 22. Entrepreneur households were more likely to be Financially Healthy.
2025 percentages in each financial health tier, by business ownership.
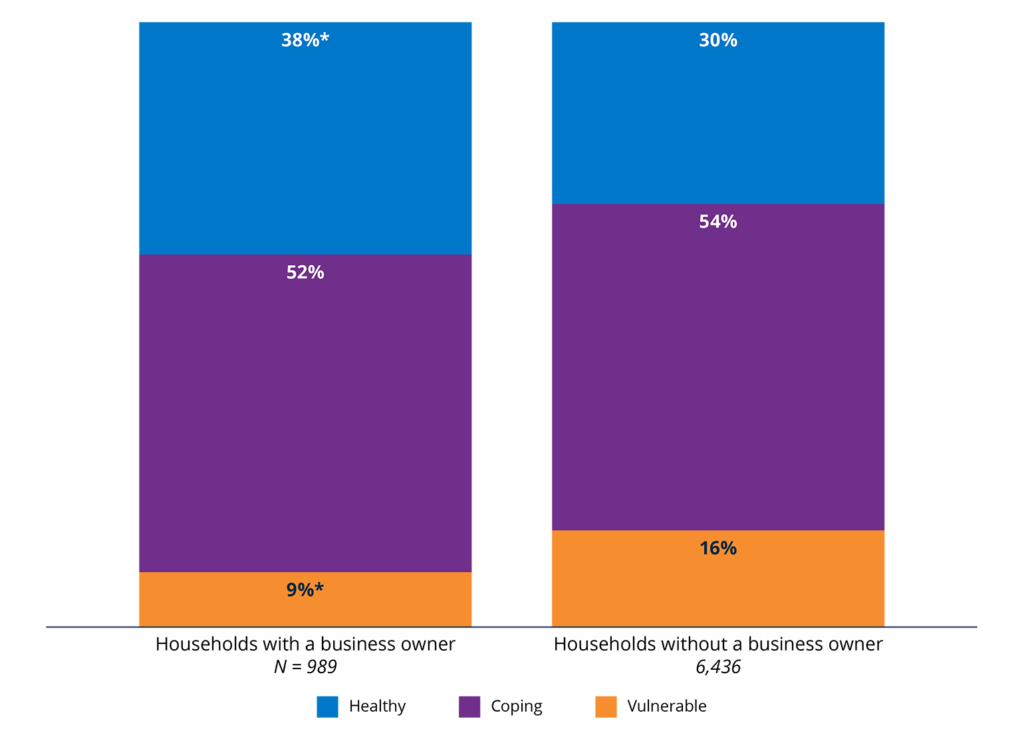
Notes: Entrepreneur households are defined as those who reported at least one business owner in the household. Two respondents skipped the question about business ownership in the household. Percentages may not sum to 100% due to rounding.
* Statistically significant relative to households without a business owner (p < .05).
Figure 23. Fully banked households were more likely to be Financially Healthy than both unbanked and underbanked households.
2025 percentages in each financial health tier, by banking status.
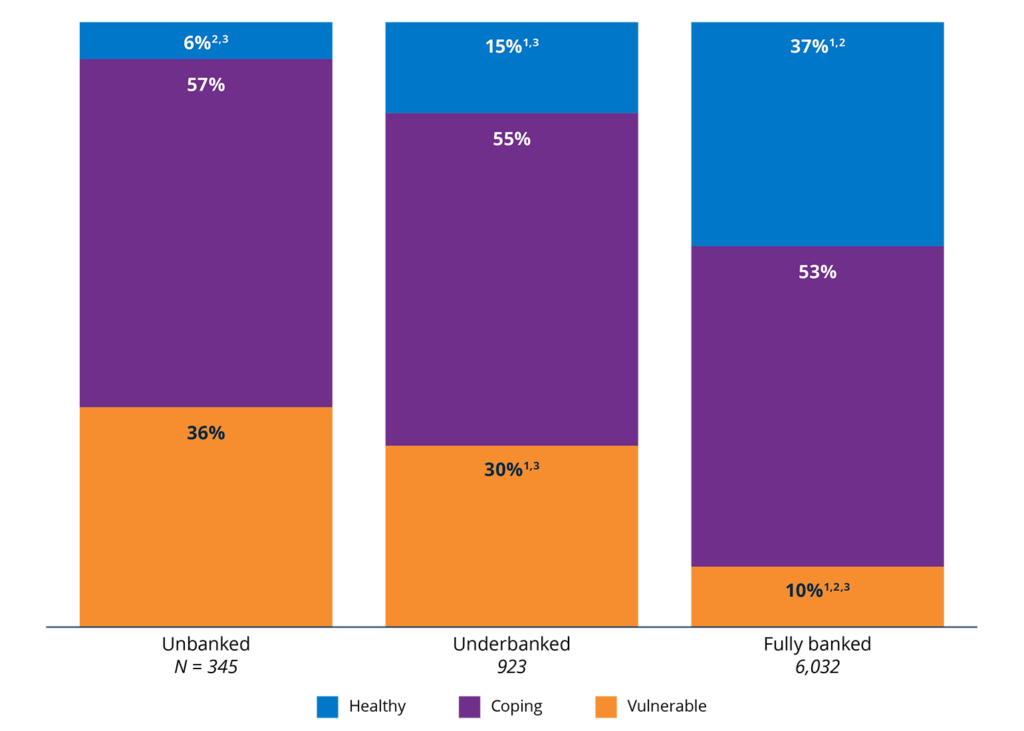
Notes: We follow the FDIC’s definition of unbanked and underbanked. For more information on how this variable is coded, see Appendix B. In 2025, 127 respondents had a missing banking status. Percentages may not sum to 100% due to rounding.
1 Statistically significant relative to unbanked (p < .05).
2 Statistically significant relative to underbanked (p < .05).
3 Statistically significant relative to fully banked (p < .05).
Demographics
Use the drop down menu to explore financial health disparities across different demographic groups in 2025.
Figure 25. Asian and white households were more likely to be Financially Healthy than Black and Latine households.
2025 percentages in each financial health tier, by race and ethnicity.
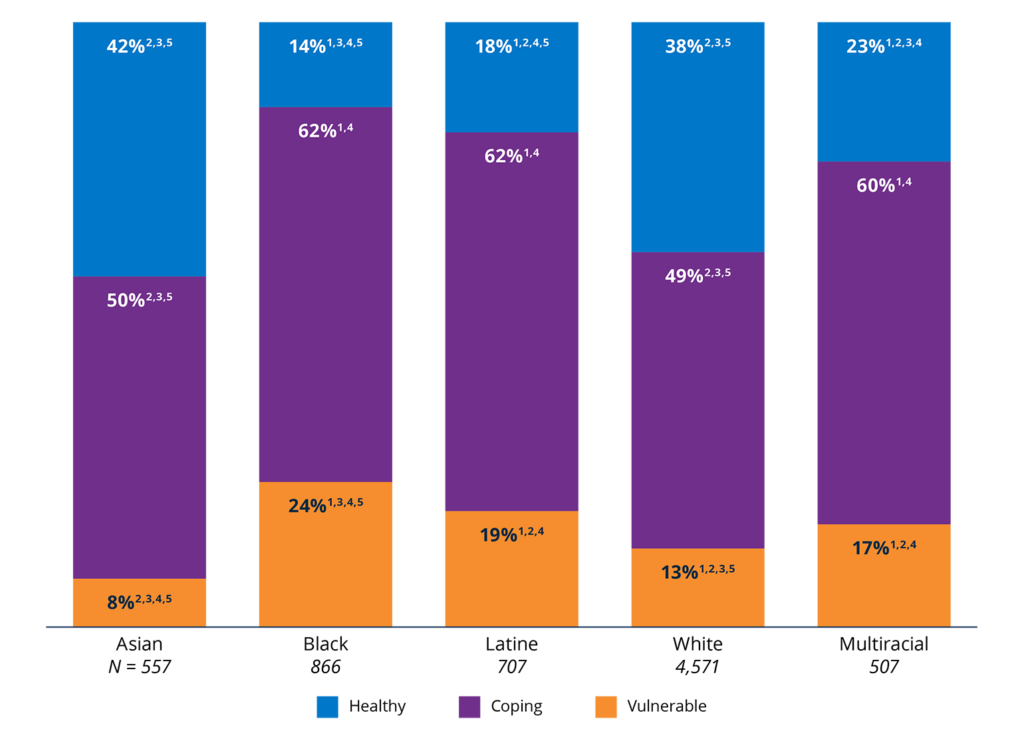
Notes: Percentage points may not sum to 100% due to rounding. In 2025, 23 respondents did not provide their race or ethnicity, and 195 selected a single other race not listed here. Due to small sample sizes, other races and ethnicities are not shown. See Appendix B for more information.
1 Statistically significant relative to Asian (p < .05).
2 Statistically significant relative to Black (p < .05).
3 Statistically significant relative to Latine (p < .05).
4 Statistically significant relative to white (p < .05).
5 Statistically significant relative to Multiracial or Multiethnic (p < .05).
Figure 27. Older people were more likely to be Financially Healthy.
2025 percentages in each financial health tier, by age.
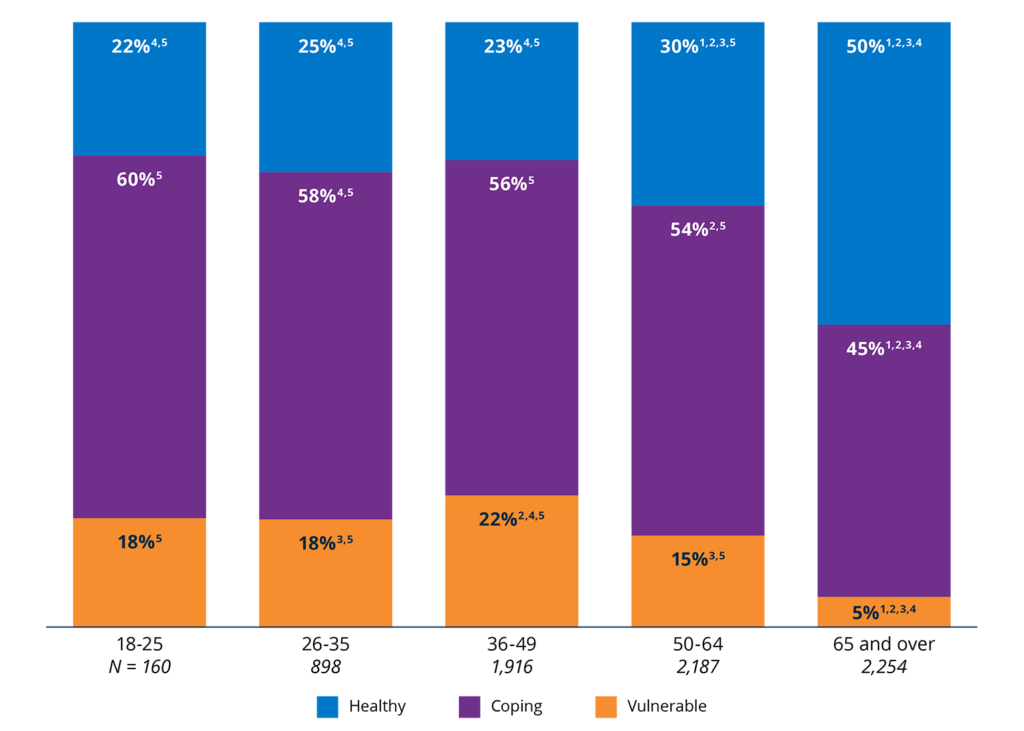
Notes: Percentage points may not sum to 100% due to rounding. In 2025, 11 respondents had a missing age.
1 Statistically significant relative to 18-25 (p < .05).
2 Statistically significant relative to 26-35 (p < .05).
3 Statistically significant relative to 36-49 (p < .05).
4 Statistically significant relative to 50-64 (p < .05).
5 Statistically significant relative to 65 and over (p < .05).
Figure 29. Partnered households were more likely to be Financially Healthy than single men, who were more likely to be Financially Healthy than single women.
2025 percentages in each financial health tier, by household gender composition.
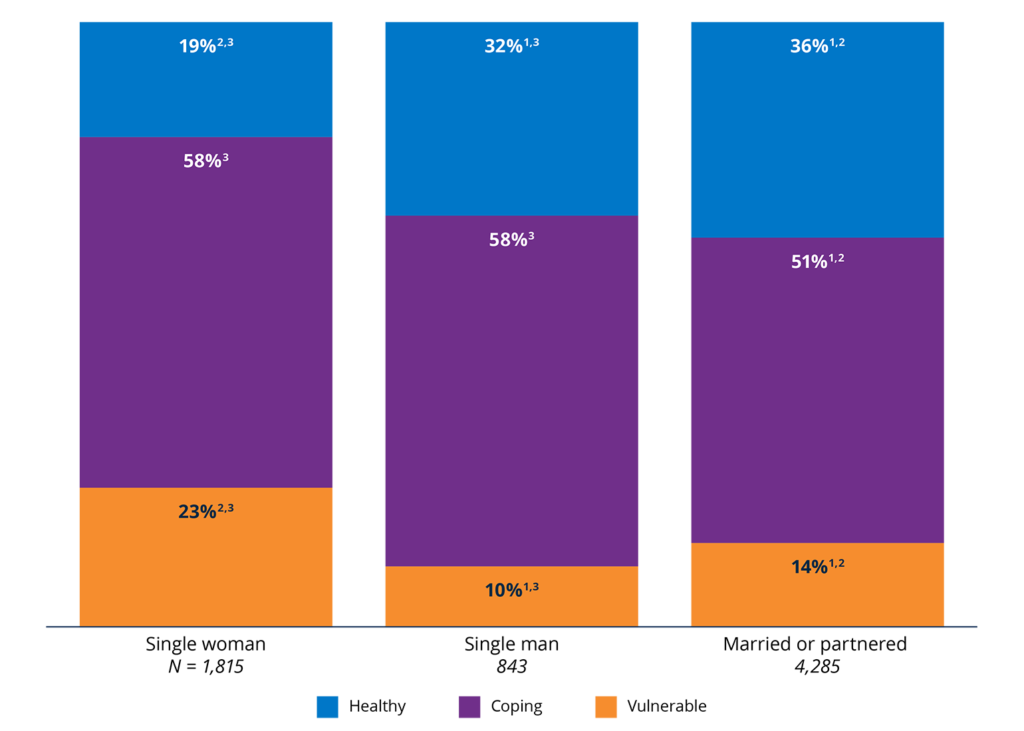
Notes: Percentage points may not sum to 100% due to rounding. In 2024, two respondents had a missing household composition. Forty-six respondents who indicated “single, other gender” were excluded due to small sample size. In 2025, 437 respondents had a missing household composition due to a change in methodology regarding gender. See Appendix B for more information.
1 Statistically significant relative to single women (p < .05).
2 Statistically significant relative to single men (p < .05).
3 Statistically significant relative to married or partnered (p < .05).
Figure 31. People born in the U.S. were more likely to be Financially Vulnerable than those not born in the U.S.
2025 percentages in each financial health tier, by country of birth.
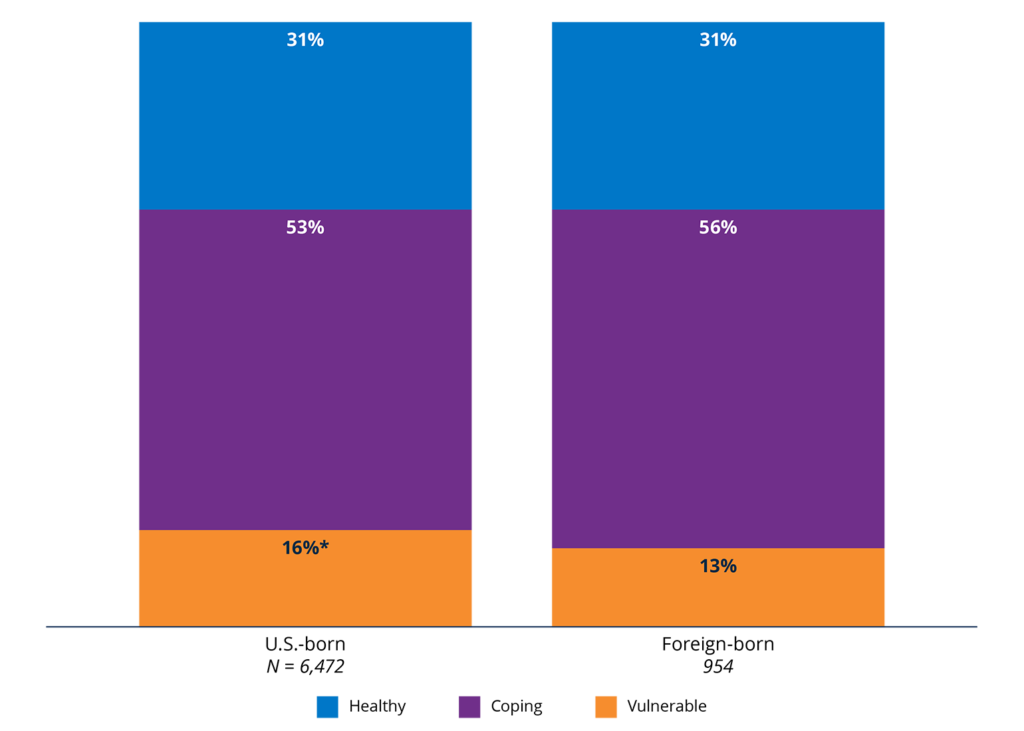
Notes: Percentage points may not sum to 100% due to rounding.
*Statistically significant relative to those not born in the US (p < .05).
Figure 33. LGBTQ+ households were less likely to be Financially Healthy than non-LGBTQ+ households.
2025 percentages in each financial health tier, by LGBTQ+ status.
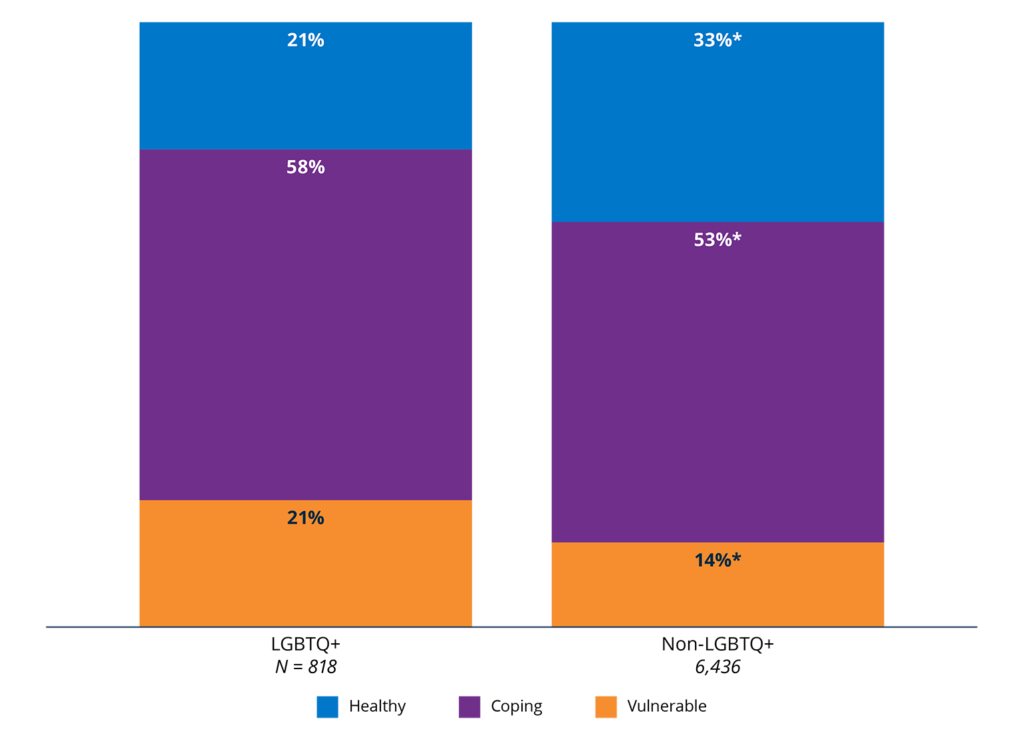
Notes: Percentage points may not sum to 100% due to rounding. In 2025, 172 respondents had a missing LGBTQ+ status. In 2025, 88 participants who responded that they were “genderqueer,” “gender non-conforming,” “nonbinary,” or “some other gender” were included in this group. Our survey question changed from 2024, therefore, 2024 data are not included in the analysis. See Appendix B for more information.
* Statistically significant relative to LGBTQ+ households (p < .05).
Figure 34. Households with a veteran were more likely to be Financially Healthy.
2025 percentages in each financial health tier, by veteran status.
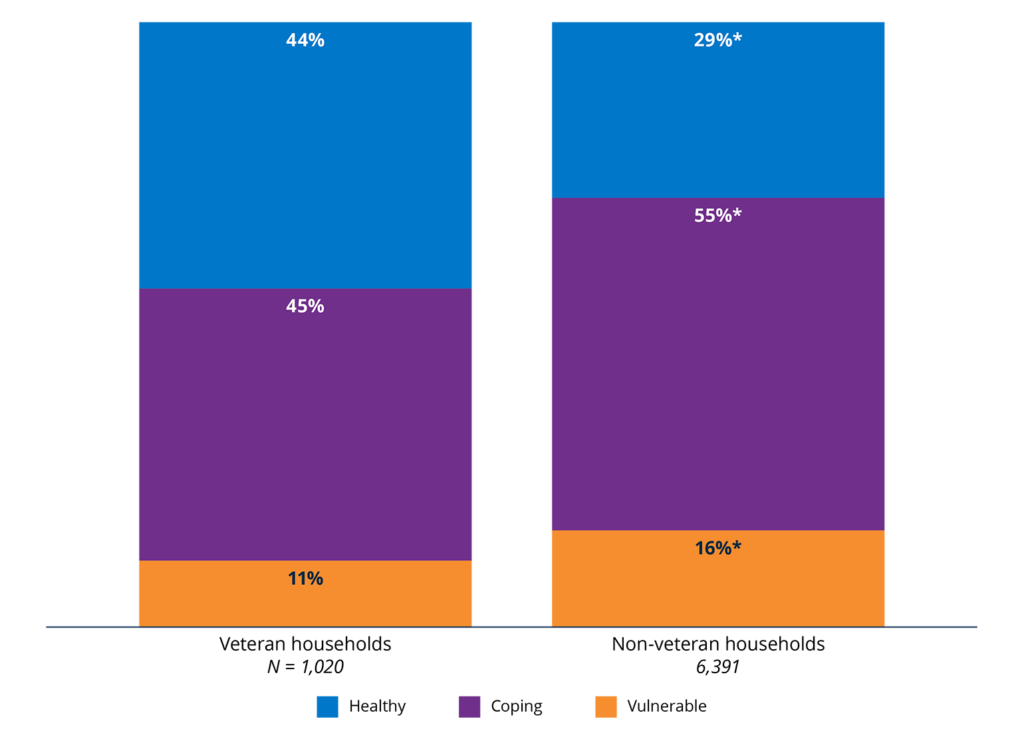
Notes: Percentage points may not sum to 100% due to rounding. In 2025, 15 respondents had a missing veteran status.
*Statistically significant relative to veteran households (p < .05).
Geography
Use the drop down menu to examine financial health variations based on geographic location in 2025.
Figure 36. Households in the South were less likely to be Financially Healthy than those in other regions.
2025 percentages in each financial health tier, by geographic region.
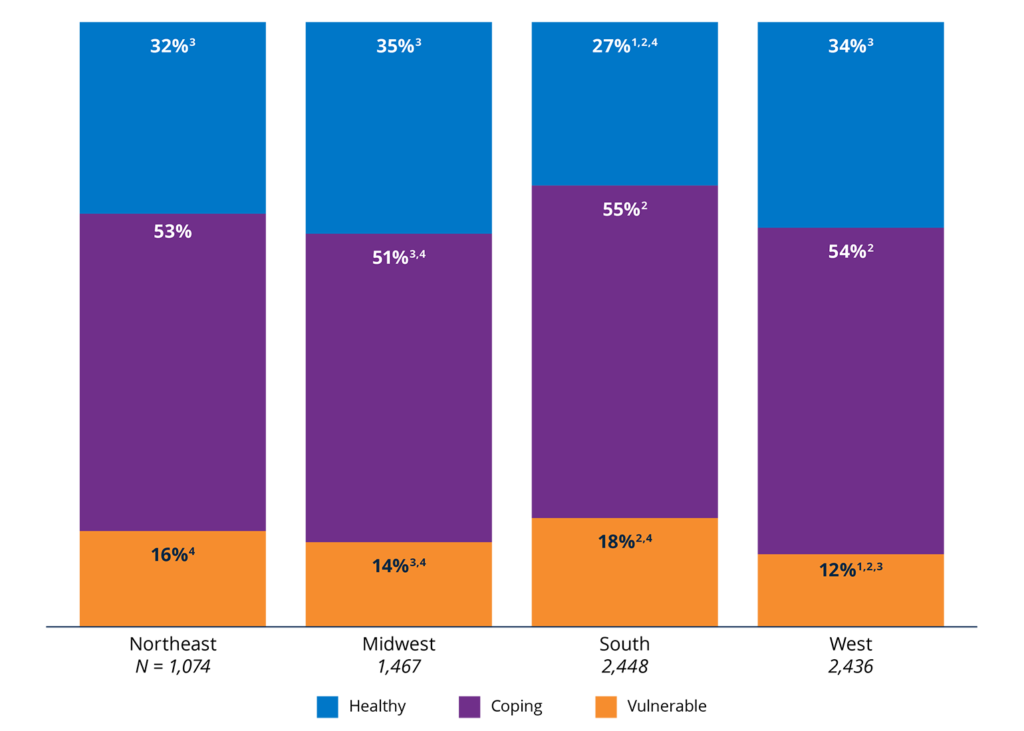
Notes: In 2025, one respondent did not provide their state of residence. Percentages may not sum to 100% due to rounding.
1 Statistically significant relative to households residing in the Northeast (p < .05).
2 Statistically significant relative to households residing in the Midwest (p < .05).
3 Statistically significant relative to households residing in the South (p < .05).
4 Statistically significant relative to households residing in the West (p < .05).
Figure 38. Rural households were less likely to be Financially Healthy than those in urban and suburban areas.
2025 percentages in each financial health tier, by urbanicity.
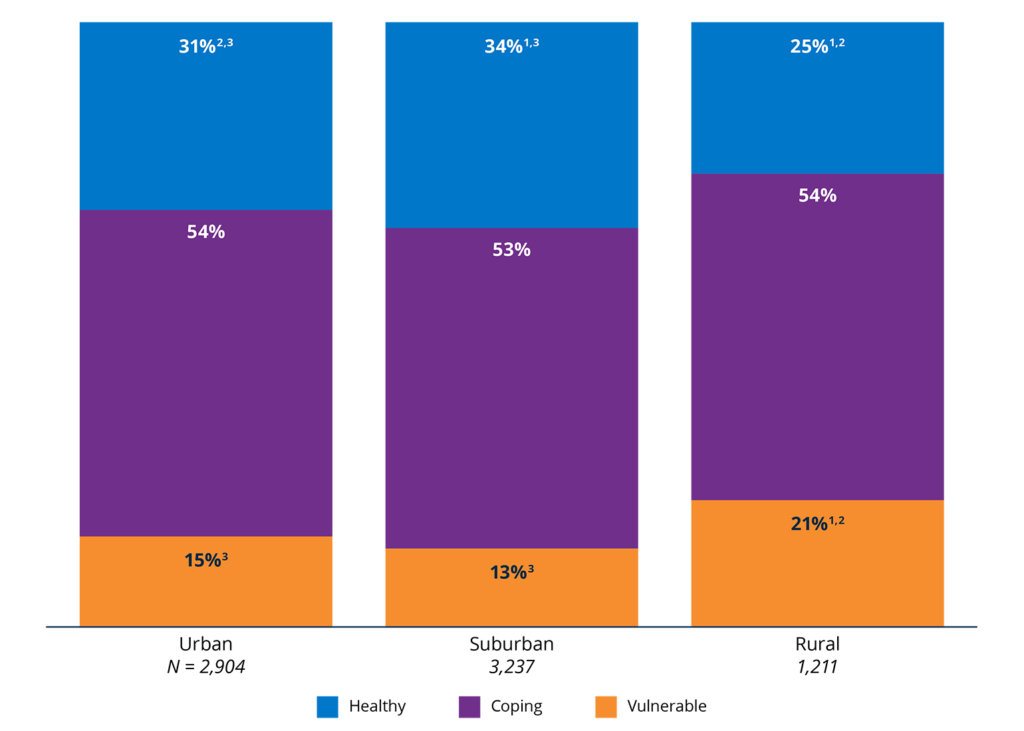
Notes: There were 74 respondents in 2025 with missing geographic information at the county level. Percentages may not sum to 100% due to rounding.
1 Statistically significant relative to those residing in urban areas (p < .05).
2 Statistically significant relative to those residing in suburban areas (p < .05).
3 Statistically significant relative to those residing in rural areas (p < .05).
Figure 40. Those who experienced a natural disaster in the last 12 months were more likely to be Financially Vulnerable.
2025 percentages in each financial health tier, by experience of a natural disaster or severe weather event.
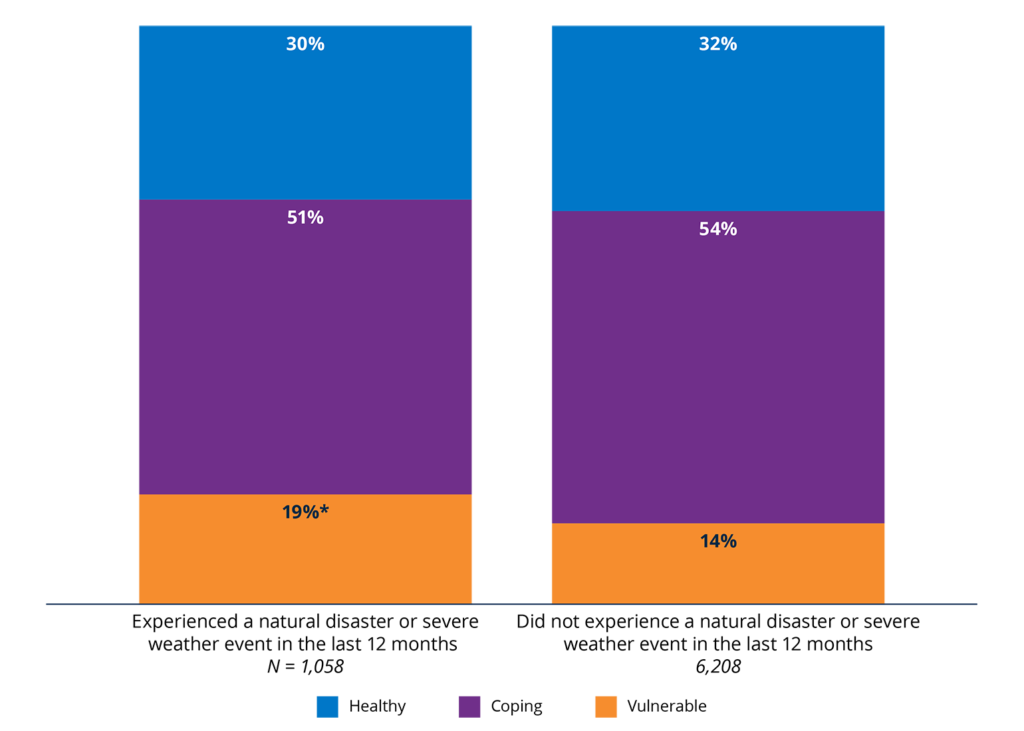
Notes: 150 respondents responded “I don’t know” and 10 skipped the question. Percentages may not sum to 100% due to rounding.
* Statistically significant relative to those who did not experience a natural disaster or severe weather event in the last 12 months (p < .05).
Employment
Use the drop down menu to discover insights into financial health related to employment status and types in 2025.
Figure 41. Those not in the labor force were the most likely to be Financially Healthy.
2025 percentages in each financial health tier, by employment status.
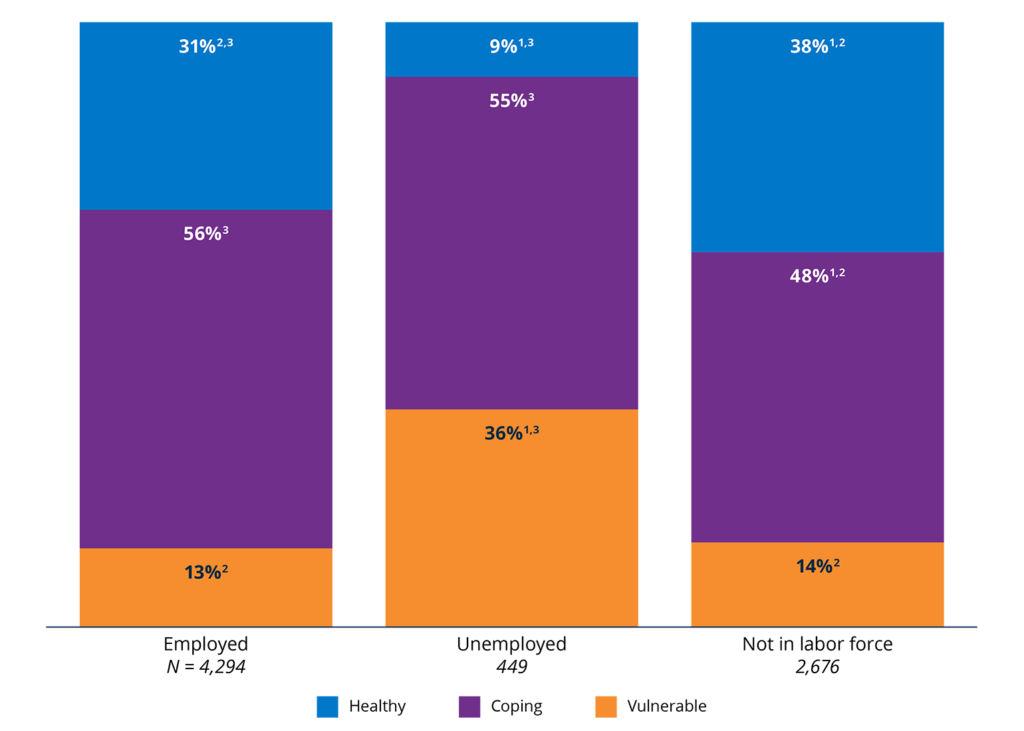
Notes: In 2025, seven respondents had a missing employment status. Percentages may not sum to 100% due to rounding.
1 Statistically significant relative to those who were employed (p < .05).
2 Statistically significant relative to those who were unemployed (p < .05).
3 Statistically significant relative to those who were not in the labor force (p < .05).
Figure 43. Non-traditional workers were less likely to be Financially Healthy than traditional employees.
2025 percentages in each financial health tier, by non-traditional employment status.
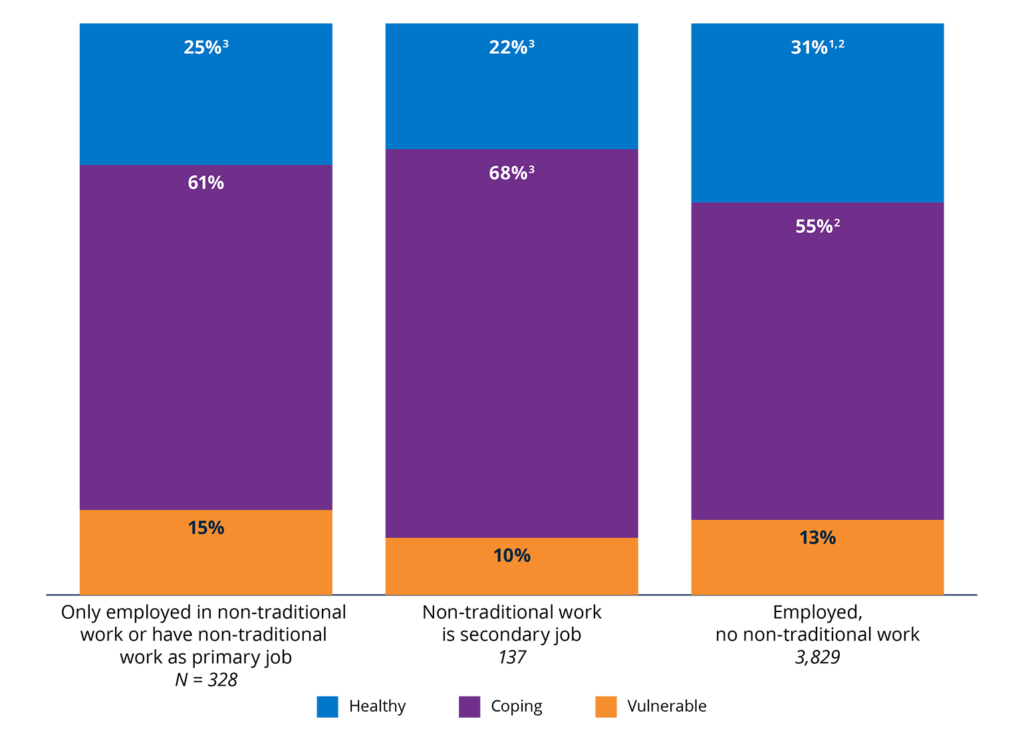
Notes: Those who were unemployed or not in the labor force were not included in this table. Percentages may not sum to 100% due to rounding.
1 Statistically significant relative to non-traditional work as a primary job (p < .05).
2 Statistically significant relative to non-traditional work as a secondary job (p < .05).
3 Statistically significant relative to no non-traditional work (p < .05).
Figure 45. Employees of smaller businesses were less likely to be Financially Healthy than employees of larger businesses.
2025 percentages in each financial health tier, by employer size.
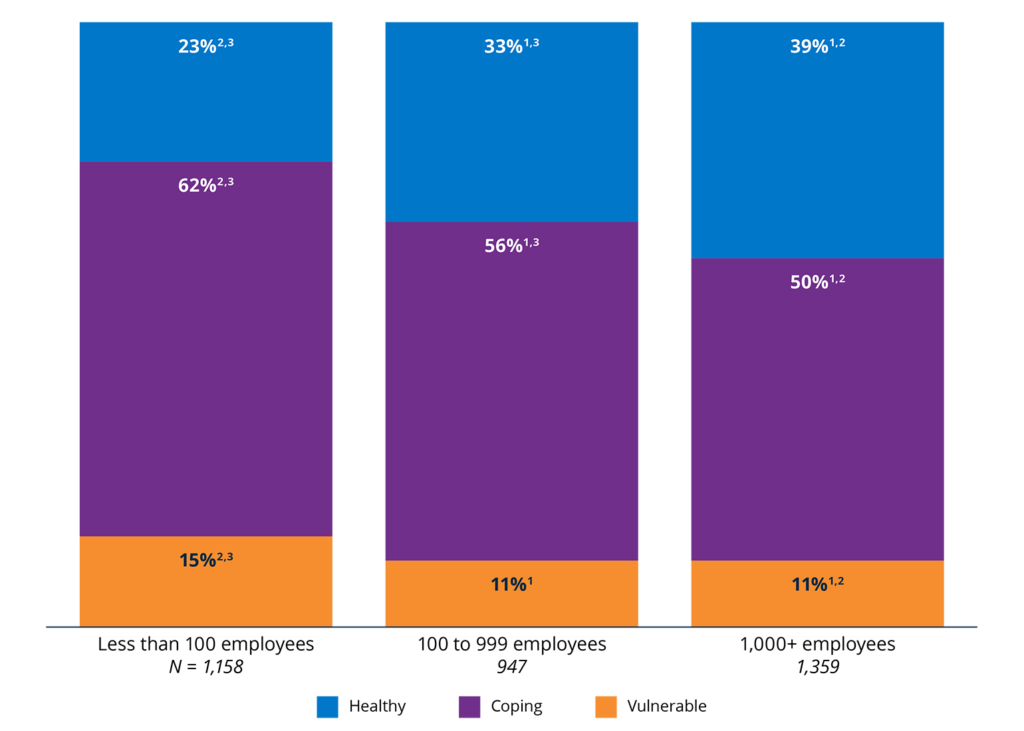
Notes: The 239 respondents who responded “I don’t know” were omitted from this table. In addition, those who were unemployed or not in the labor force were not included in this table. Percentages may not sum to 100% due to rounding.
1 Statistically significant relative to less than 100 employees (p < .05).
2 Statistically significant relative to 100-999 employees (p < .05).
3 Statistically significant relative to 1000+ employees (p < .05).
Figure 47. Employees with access to employee ownership benefits had similar levels of financial health as those without access.
2025 percentages in each financial health tier, by access to employee ownership benefits.
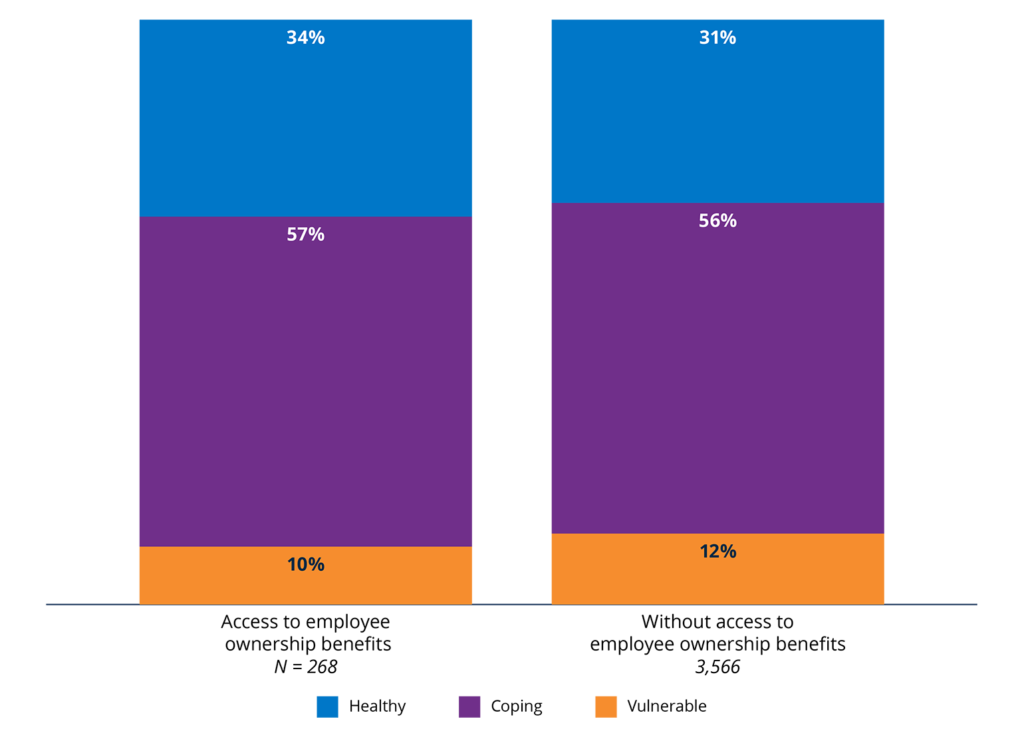
Notes: The 217 respondents who responded “I don’t know” were omitted from this table. An additional 243 respondents did not receive our question on Employee Stock Ownership Plans (ESOPs) and were not included in the analysis. In addition, those who were unemployed or not in the labor force were not included in this table. Percentages may not sum to 100% due to rounding.
Figure 49. Employees in unions were less likely to be Financially Vulnerable than non-union employees.
2025 percentages in each financial health tier, by union membership.
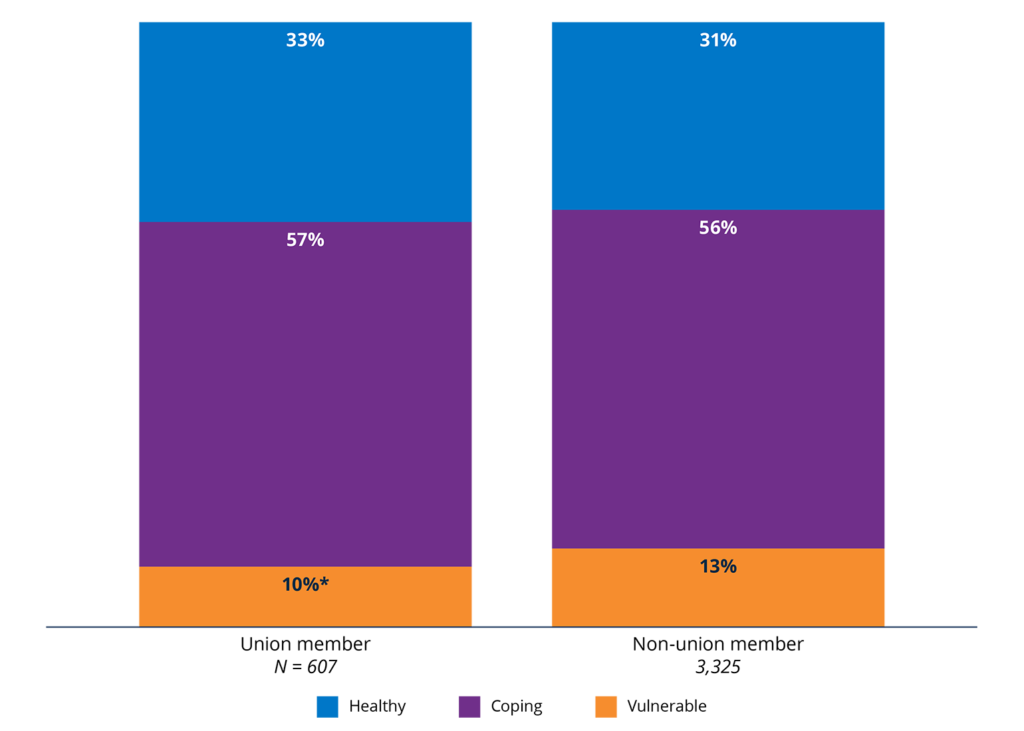
Notes: Asked to all respondents who were employees or non-traditional workers. In 2025, 119 participants responded “Don’t know” and were excluded from analysis. Percentages may not sum to 100% due to rounding.
* Statistically significant relative to non-union members (p < .05).
Health and Disability
Use the drop down menu to analyze financial health trends among different health and disability groups in 2025.
Figure 50. Overall health was positively associated with financial health.
2025 percentages in each financial health tier, by self-rated overall health.
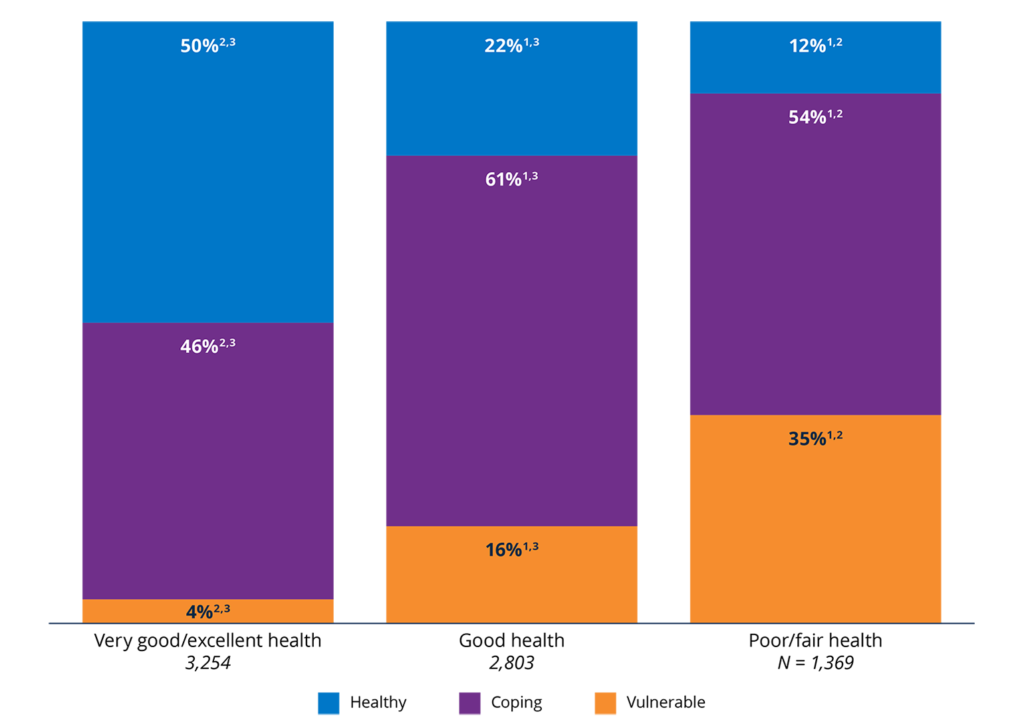
Notes: Percentages may not sum to 100% due to rounding.
1 Statistically significant relative to those who self-rated “excellent” or “very good” (p < .05).
2 Statistically significant relative to those who self-rated “good” (p < .05).
3 Statistically significant relative to those who self-rated “fair” or “poor” (p < .05).
Figure 52. Mental health was positively associated with financial health.
2025 percentages in each financial health tier, by self-rated mental health.
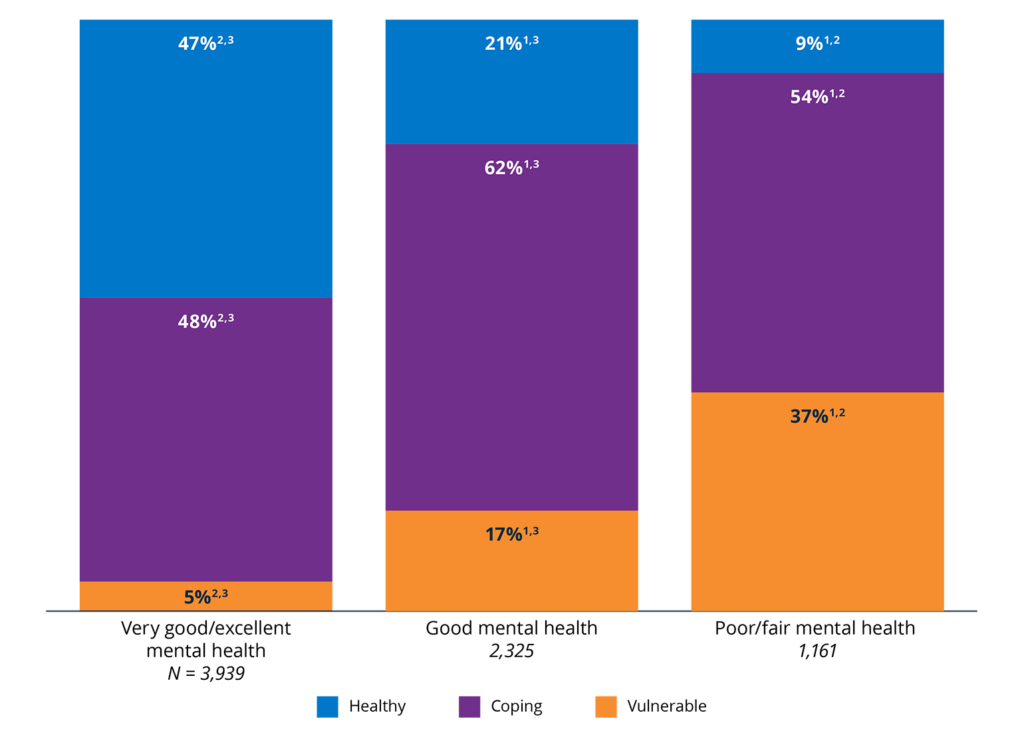
Notes: Percentages may not sum to 100% due to rounding. In 2025, one participant was missing self-rated mental health.
Percentages may not sum to 100% due to rounding.
1 Statistically significant relative to those who self-rated “excellent” or “very good” (p < .05).
2 Statistically significant relative to those who self-rated “good” (p < .05).
3 Statistically significant relative to those who self-rated “fair” or “poor” (p < .05).
Figure 54. People with disabilities were less likely to be Financially Healthy than those without disabilities.
2025 percentages in each financial health tier, by disability status.

Notes: Percentages may not sum to 100% due to rounding. In 2025, 14 participants were missing disability.
* Statistically significant relative to those who have a disability (p < .05).