Research Paper

The Financial Health of Nonprofit Workers

America’s 12 million nonprofit workers play a vital role in our economy, yet many lack the job benefits needed to support their financial health.

By Lisa Berdie, Amber Jackson, Riya Patil

Tuesday, September 9, 2025
 The Financial Health of Nonprofit Workers

Understanding the Financial State of the Nonprofit Workforce

The nonprofit sector has grown steadily over the last two decades, expanding even during the Great Recession as other industries contracted.1 Today, nonprofits contribute over $1.4 trillion to the U.S. economy annually and employ over 12 million people (9% of the total workforce).2 Yet nonprofit workers remain relatively understudied compared to their for-profit peers, a gap that is especially concerning as the sector faces ongoing staffing shortages. 

This paper seeks to rebalance that attention, focusing on the financial health of this critical part of the U.S. workforce. Drawing on findings from our first Nonprofit Worker Financial Health and Benefits Survey 2024-2025, we analyze how workers are faring financially, key differences by employer size and industry, and the job factors that shape worker finances.

Our findings point toward gaps in specific benefit offerings, as well as disparities in uptake of those benefits. It also highlights key opportunities to improve overall job quality and build a healthy, engaged nonprofit workforce.

Key Findings

A man using and paying credit card

Nonprofit workers outside of university and hospital settings, and workers in organizations with annual budgets of less than $1 million, are less likely to be Financially Healthy. 

Stressed woman sits at a desk at home, reading a document beside her laptop. She appears worried and stressed, resting her head in her hands while managing her pension finances.

Black and Hispanic nonprofit workers and women are more often Financially Vulnerable

1 in 7 nonprofit employees lack access to any “core” employer-sponsored benefits: paid time off, sick leave, retirement plans, and health insurance.

Vulnerable groups reported the lowest satisfaction with their benefits offerings, particularly wages, time off, and health insurance.

Data Spotlight

Which nonprofit workers have access to core workplace benefits?

We asked nonprofit workers what workplace benefits they have access to through their employer, and which of those benefits they enroll in or use. When we focus on four core benefits – those that are most widely offered by employers: paid vacation, paid sick leave, employer-sponsored health insurance, and an employer-sponsored retirement plan – we find that just over half (52%) of workers have access to all four of these benefits. Only 43% of Financially Vulnerable nonprofit workers have access to all four of these benefits, compared to 58% of Financially Healthy nonprofit workers and 51% of Financially Coping nonprofit workers.

Figure 4. Access to core workplace benefits.

Stacked bar chart depicting access to core benefits by nonprofit workers. 52% have access to 4 core benefits; 18% have access to 3 core benefits; 9% have access to 2 core benefits; 6% have access to 1 core benefit; 15% have access to 0 core benefits;

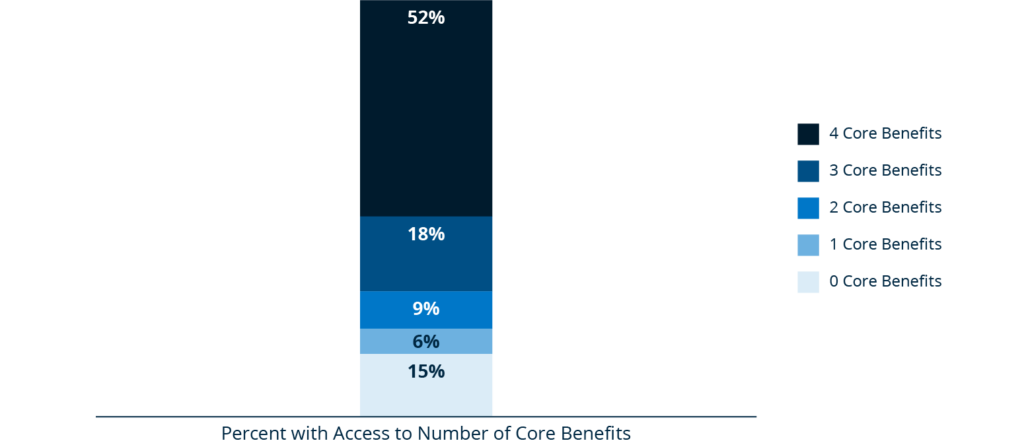
Notes: Nonprofit Worker Financial Health and Benefits Survey 2024-2025. N = 1,180.
May not sum to 100% due to rounding.

About Our Methodology

Data for this study were collected through a 20-minute online survey administered via Ipsos’ KnowledgePanel®, an online panel that recruits participants through probability-based sampling methods in order to provide nationally representative estimates of employed adults (age 18 and older). A total of 1,180 adults participated in the survey. All respondents were currently employed by a nonprofit organization; 11.5% of invited households qualified for the survey, roughly aligned with national estimates that 9% of workers are employed by a nonprofit organization. 

To ensure meaningful segmentation, the survey captured detailed worker and organizational characteristics, including race and ethnicity, gender, income, educational attainment, employment status, role, and household composition, as well as the employer’s organization size, issue area, funding sources, and geographic focus. Fielding was monitored to maintain balance across key segments. 

After data collection, we weighted our data to align with the distributions for adult employed Americans, based on benchmarks from the 2024 March Supplement to the Current Population Survey (CPS), and 2023 American Community Survey (ACS). The survey margin of error is ±3.42% (95% confidence level).

Acknowledgements

This research report is made possible through the financial support of Prudential Financial, Inc. The insights and opinions expressed in this report are those of the Financial Health Network and do not necessarily represent the views or opinions of our partners, funders, and supporters. 

Endnotes
  1. Nonprofits: A Look at National Trends in Establishment Size and Employment.” Bureau of Labor Statistics Monthly Labor Review, January 2024.
  2. Health of the U.S. Nonprofit Sector,” Independent Sector, December 2024.

Written by

Lisa Berdie

Director, Research
Financial Health Network

Amber Jackson

Associate, Research
Financial Health Network

Riya Patil

Senior Associate, Workplace Solutions
 

The Financial Health of Nonprofit Workers

Explore the trends. Discover new insights. Build stronger strategies.