Pulse Points Fall 2021: How Families Are Using Child Tax Credits
New Pulse transactional data suggests that child tax credit payments have had a positive financial impact on recipients, particularly those who experienced hardship in the past.

For Child Tax Recipients, Median Inflows Increased $500
We observed child tax credit deposits in the accounts of one quarter (25%) of individuals in our transactional dataset, which is comparable to the 27% of U.S. households who received a child tax credit. Median monthly account inflows for child tax credit recipients increased by about $500 (roughly a 7% increase in inflows). This amount aligns with U.S. Treasury Department statistics, which reported that average child tax credit amounts were $423 in July and $428 in August. This data affirms that our findings on child tax credit usage can be extrapolated to the population of recipients at large.
Median Monthly Inflows Rose by Approximately $500 for Child Tax Credit Recipients

Source: Pulse Transactional Dataset (July 1 to September 30, 2021) Sample size: 70 individuals for whom child tax credits were observed. Notes: Line chart shows a $500 average increase to account inflows including child tax credits compared with excluding child tax credits. Inflows are defined as the daily median of liquid account inflows over the past 30 days.
Spending on Food Increased Among Recipients Who Faced Food Insecurity
People who indicated that they previously experienced food insecurity increased their average monthly spending on food by $345, or 49% (from $711 on July 10 to $1,056 on September 7). Meanwhile, there was no significant change in spending on food for people who did not receive child tax credits and had previously experienced food insecurity. This trend is consistent with recent research: Census Household Pulse surveys indicate that households with children saw a 3 percentage point drop in food insufficiency as tax credits were distributed, while other research indicates that child tax credits were particularly beneficial for lower-income families.
People Who Experienced Food Insecurity Increased Spending on Food After Receiving Child Tax Credits
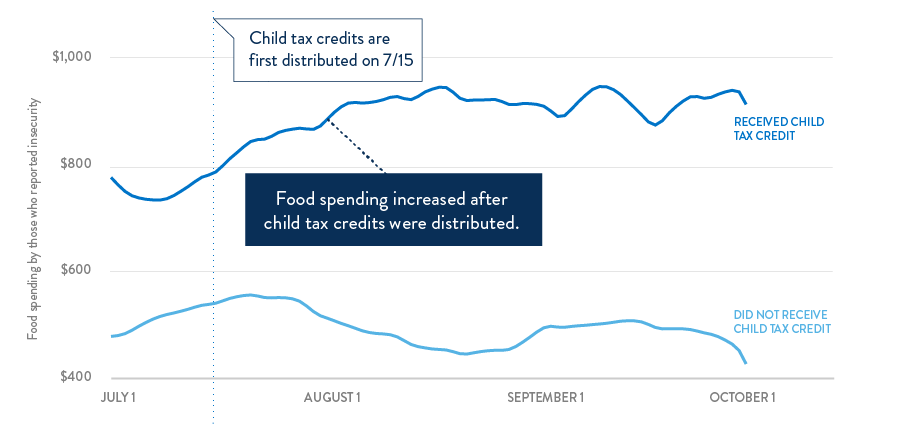
Source: Pulse Transactional Dataset (July 1 to September 30, 2021) Sample size: 60 individuals who experienced food insecurity. 38 did not receive child tax credits and experienced food insecurity, and 22 received child tax credits and experienced food insecurity. Notes: Line graph showing that spending on food increased 49% or $345 on average among those who experienced food insecurity after receiving child tax credits.There was no significant change for people who did not receive the child tax credit and experienced food insecurity. Food insecurity is defined as a respondent indicating in their most recent survey response that they were worried in the past 12 months about their food running out before they got to buy more. Spending is defined as the sample mean of total spending on “eating in” and “eating out,” as categorized by Plaid, in the past 30 days. This is calculated on a daily basis.
Spending on Healthcare Increased Among Recipients With Previous Struggles
Child tax credit recipients who previously struggled to pay for healthcare necessities increased their spending on healthcare. A fixed effects regression shows that recipients who experienced difficulty paying for medical or prescription expenses (as reported on their most recently completed Pulse survey) increased their monthly spending on healthcare from $42 to $72 in the three weeks following receipt of child tax credits, a difference of 72% ($30). These results suggest that child tax credits contributed to higher healthcare spending among those who previously struggled to pay healthcare expenses. Furthermore, this trend aligns with research from the JPMorgan Chase Institute showing that income tax refund recipients increased their spending on healthcare expenses immediately after receiving their refunds.
People Who Struggled to Afford Healthcare Spent More on Healthcare After Receiving Child Tax Credits

Source: Pulse Transactional Dataset (July 1 to September 30, 2021) Sample size: 69 individuals for whom child tax credits were observed and who participated in Pulse surveys; 39 who did receive child tax credits and did not struggle to afford healthcare and 21 who received child tax credits and struggled to afford healthcare. Notes: Bar chart showing $72 in healthcare spending in the three weeks following receipt of child tax credits for those with previous struggles affording healthcare, and $42 in healthcare spending for those who did not receive child tax credits and reported previous struggles affording healthcare. Struggling to afford healthcare is defined as a participant indicating in their most recent Pulse survey response that they did not get the healthcare they needed in the past 12 months because they could not afford it, or by a response indicating the respondent stopped taking medication or took less in the past 12 months due to the costs. Spending is defined as the daily average of spending on healthcare over the past 30 days.
Child Tax Credit Recipients are Not (Yet) Building Savings
Our analysis shows that child tax credit recipients’ liquid account balances remained largely flat after they received credits. While inflows increased as people received child tax credits, outflows kept pace as recipients spent or transferred this money. This indicates that recipients may be using child tax credits differently than how they used stimulus payments earlier in the COVID-19 pandemic. While many stimulus recipients used their payments to build savings buffers, child tax credit recipients do not appear to be using funds to build their savings in the same way.
Liquid Account Balances Have Not Changed Significantly for Child Tax Credit Recipients

Source: Pulse Transactional Dataset (July 1 to September 30, 2021) Sample size: 70 individuals for whom child tax credits were observed. Notes: Line chart showing that liquid account balances of child tax credit recipients did not significantly change between July and September. Liquid account balances are defined as the daily median of average liquid account balances over the past 30 days.
There are several potential explanations for why stimulus payments led to an increase in liquid account balances, while child tax credits have not.
-
- Child tax credits are distributed to a more targeted segment of the U.S. than stimulus payments – 27% of U.S. households received child tax credits, while an estimated 85% received stimulus payments. People with children may have more immediate uses for the tax credits, while a large proportion of stimulus payment recipients were able to use the payments to build savings.
- The child tax credits in our analysis were distributed at a particularly costly time of year for families with children – the return to school. As a result, spending patterns during the time families received child tax credits may look different than during the time Americans received stimulus payments.
- The average value of child tax credits is smaller than stimulus payments due to the recurring monthly disbursement schedule of the tax credits. Furthermore, tax credit recipients may mentally account to spend the money each month, while stimulus payments represented a novel windfall for many. Recipients may view the recurring nature and framing of child tax credits as money that is easier to spend.
Still, other research indicates that some families are using the child tax credits to increase their savings. This may indicate that recipients have not yet accumulated a significant amount of savings, or that they intend to eventually shift further from spending on expenses to saving. It is also possible that recipients are transferring money into accounts (i.e., savings transfers or paying down debt) that we are unable to observe in the Pulse transactional dataset. Regardless, as the debate over extending child tax credits continues, two things appear clear. In the present, these credits are helping families get by, and if they expire, there is a real risk that recipients will not have a financial cushion.


Written by
-
 Senior Manager, Data
 -
 Associate, Data
 -
 Manager, ResearchFinancial Health Network