Research Paper

Once Financially Unhealthy, Always Financially Unhealthy?

A five-year analysis of Financial Health Pulse® research shows two critical ways that Americans struggle with financial health.

Wednesday, April 19, 2023
 Once Financially Unhealthy, Always Financially Unhealthy?

Introduction

Annual estimates of financial health show that a similar share of Americans are not Financially Healthy in any given year – between 66% and 72% from 2018 through 2022.1 This means that they struggle to spend, save, borrow, or plan in a way that contributes to their ability to be resilient and thrive. Although annual reports of financial health provide important insights into the share of Americans who are Financially Unhealthy at a specific moment in time, they cannot show whether individuals remain Financially Unhealthy consistently or their financial health changes from year to year.2,3,4,5

This implies that there are two different ways to experience a lack of financial health. In one case, being Financially Unhealthy is a chronic experience for households; in the other, it is temporary. This report investigates these two different experiences by asking:

    • Are Americans more likely to be chronically Financially Unhealthy (meaning that they remain Financially Unhealthy for many years in a row) or intermittently Financially Unhealthy (meaning that they spend some years Financially Unhealthy and other years Financially Healthy)? 
    • Are there demographic disparities either in being chronically Financially Unhealthy or in being intermittently Financially Unhealthy?
    • Are there life events related to being chronically Financially Unhealthy?
    • Are there life events related to being intermittently Financially Unhealthy?

Data and Methodology

To understand whether someone’s financial health changes from year to year, we used five waves of the annual Financial Health Pulse survey fielded to the Understanding America Study (UAS) panel by the University of Southern California (USC) Dornsife Center for Economic and Social Research (CESR) every year from 2018 to 2022.6 All UAS panelists for each year are invited to complete the Financial Health Pulse survey online between April and May of each year. Of the more than 5,000 respondents who participated in the 2018 survey, 2,818 also participated in the following four waves.7 (For details, see Table A1 in the Appendix, found in the PDF version of this report). These respondents constitute our final sample, which we weight to be representative of race, ethnicity, age, gender, education, and census region distributions of U.S. adults in 2022.8 

In each of the five years of our Pulse survey, we ask about eight different indicators of financial health. Averaging across all eight indicators, we calculate a FinHealth Score® to measure an individual’s financial health in each year. An individual’s FinHealth Score can range from 0 to 100, and we identify Financially Healthy individuals as those with scores of 80 or above, and Financially Coping or Financially Vulnerable individuals with scores below 80.9,10 In this analysis, we group the latter two tiers into a single tier: Financially Unhealthy.

Key Findings

1. More than 4 out of 5 Americans were Financially Unhealthy for at least one year.

More than four-fifths (83%) of individuals were Financially Unhealthy at least once between 2018 and 2022 (see Figure 1). This is more than the 66% to 72% of Americans reported in annual estimates, suggesting that year-to-year reports of financial health do not fully capture how widespread and commonplace of an experience it is to be Financially Unhealthy.

Figure 1. Percentage of people who remained Financially Healthy versus people with Financially Unhealthy periods (2018-2022.)

Percentage of people who remained Financially Healthy versus people with Financially Unhealthy periods

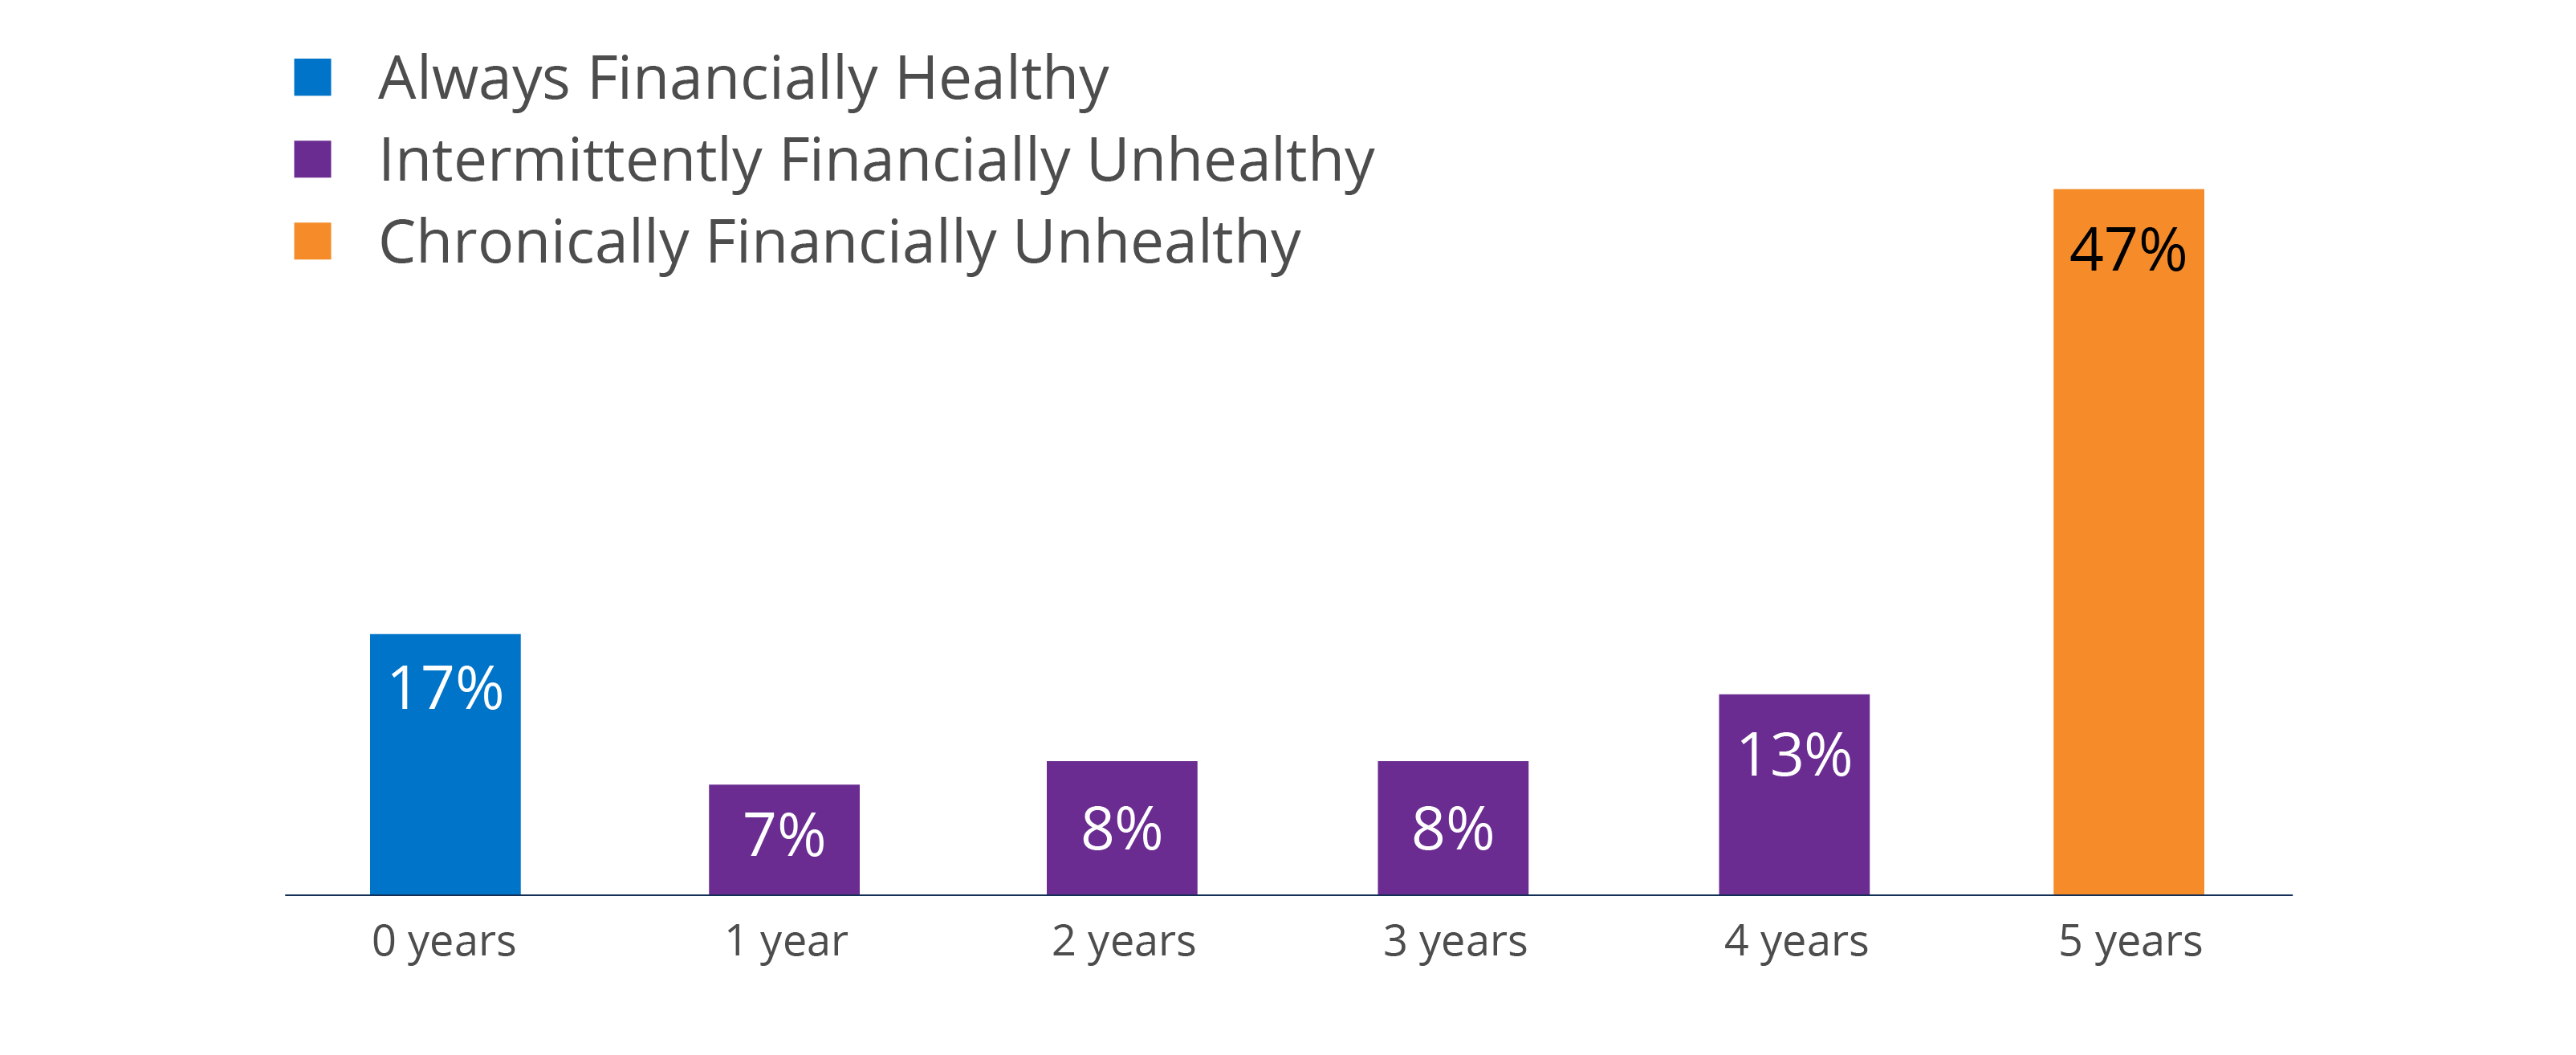
2. Being Financially Unhealthy is a temporary issue for some, but a chronic challenge for many others.

More than one-third of Americans (36%) were Financially Unhealthy for one to four years, meaning that they were Financially Unhealthy in some years but not others. In contrast, nearly half (47%) were Financially Unhealthy for at least five years (see Figure 2).11 This suggests that being Financially Unhealthy is experienced in two distinct ways: For one group, being Financially Unhealthy was a chronic situation lasting for at least five years; for another, it was intermittent – part of a cycle between being Financially Healthy and Unhealthy.12

Figure 2. Number of years people were Financially Unhealthy.

Number of years people were Financially Unhealthy

3. Certain demographic groups more frequently reported being chronically Financially Unhealthy, but this was not the case for being intermittently Financially Unhealthy.

Across race and ethnicity, household income, gender, education, and ability, there were larger and more significant disparities in being chronically Financially Unhealthy than in being intermittently Financially Unhealthy.13 

Black and Latinx people (63% and 54%, respectively) more frequently faced chronic financial health challenges than White people (44%), although they were as frequently intermittently Financially Unhealthy as White people (see Figure 3). On the other hand, Asian people (21%) were less frequently intermittently Financially Unhealthy than White people (37%). The percentage of Asian people who were chronically Financially Unhealthy (54%) was also larger than the percentage of White people (44%), but this was not a statistically significant difference, largely due to the small sample size of chronically Financially Unhealthy Asian people. 

About two-thirds of those with household incomes of $100,000 or more (66%) were either chronically or intermittently Financially Unhealthy. They were less frequently Financially Unhealthy on a chronic basis than people in any other income group. However, they were more frequently Financially Unhealthy on an intermittent basis than those with less than $30,000 in household income or those in the $30,000 to $59,999 income bracket.

More than half of women (55%) were chronically Financially Unhealthy, compared with 40% of men, but they were intermittently Financially Unhealthy as frequently as men (34% vs. 36%).14 Similarly, those without a bachelor’s degree (60%) were chronically Financially Unhealthy more frequently than those who held a bachelor’s degree (35%), but they were intermittently Financially Unhealthy as frequently. People with disabilities more frequently lacked financial health on a chronic basis (57%) than people without disabilities (44%), but there was little difference in the proportion of respondents who were intermittently Financially Unhealthy. 

With respect to LGBTQIA+ status, we observe no differences in being either chronically or intermittently Financially Unhealthy. However, LGBTQIA+ people were less frequently Financially Healthy in all five years.

This suggests that members of certain demographic groups – those who are Black or Latinx; those with household incomes below $100,000; women; those without a bachelor’s degree; and those with a disability – are at a greater risk of being chronically Financially Unhealthy than their counterparts in other racial, income, gender, or education groups. In contrast, with a few exceptions, the risk of being intermittently Financially Unhealthy does not vary across demographic segments.

Figure 3. Financial health history by race and ethnicity, household income, gender, education, ability, and LGBTQIA+ status.

Financial health history by race and ethnicity, household income, gender, education, ability, and LGBTQIA+ status

* Statistically significant difference relative to the reference category (p < 0.05); robust standard errors. † Reference category.

4. Specific life events are closely related to being chronically Financially Unhealthy.

While our data do not allow us to establish direct causality, this section endeavors to better understand life events that may be related to a chronic lapse in financial health. People who experienced some life events – such as being a homeowner, having a savings account, always being married or living with a partner, and having a retirement account – were less frequently Financially Unhealthy on a chronic basis (see Figure 4). 

People who had other experiences – such as unemployment, having a major medical expense, providing a lower self-assessed physical and mental health rating, and having different types of debt – were associated with higher incidence of chronic financial challenges.15 In the case of credit card debt, those who had some years with debt were chronically Financially Unhealthy more often than those who never reported holding these types of debt. Those who reported auto loans or student loans every year were more often chronically Financially Unhealthy.16

Figure 4. Percentage of people who are chronically Financially Unhealthy, by life events experienced.

Percentage of people who are chronically Financially Unhealthy, by life events experienced.

* Statistically significant difference relative to the reference category (p < 0.05); robust standard errors. † Reference category.

5. Similarly, certain life events are strongly associated with intermittent lack of financial health.

While the previous section considered how certain life events were related to a chronic lack of financial health, this section investigates whether similar life events are related to being intermittently Financially Unhealthy by focusing on people whose financial health changed between 2018 and 2022. Figure 5 displays the relationship between experiencing a certain life event and becoming Financially Unhealthy in the same year; the figure reflects these relationships among those who were intermittently Financially Unhealthy between 2018 and 2022 because this is the only group who experienced changes in their financial health. We present the results as a percentage change in the odds of becoming Financially Unhealthy when a life event is experienced. In Figure 5, values to the right of the center line can be interpreted as an increase in the odds of becoming Financially Unhealthy, and values to the left can be interpreted as a decrease in the odds of becoming Financially Unhealthy. 

Some changes in people’s life circumstances were related to becoming Financially Unhealthy in the same year. Losing a job, for instance, is associated with more than a twofold (116%) increase in the odds of becoming Financially Unhealthy. A reduction in people’s self-assessed health is associated with a 69% increase in the odds of becoming Financially Unhealthy. Similarly, experiencing a major medical expense is associated with a 39% increase in the odds of becoming Financially Unhealthy.

On the other hand, some life events are associated with a reduced risk of becoming Financially Unhealthy. For instance, an increase in household income from less than $30,000 to an income of $30,000 or more coincides with reduced odds of becoming Financially Unhealthy by nearly half. Becoming a homeowner is also linked to a 37% reduction in the odds of becoming Financially Unhealthy. Moreover, paying off a mortgage, student loan debt, and credit card debt are associated with reduced odds of becoming Financially Unhealthy by 38%, 45%, and 46%, respectively. Finally, opening a savings account is associated with a 34% reduction in the odds of becoming Financially Unhealthy.

Figure 5. The percentage change in odds of becoming intermittently Financially Unhealthy
by life event experienced.

The percentage change in odds of becoming intermittently Financially Unhealthy, by life event experienced.

* Statistically significant difference relative to not experiencing the event (p < 0.05). Notes: Results are from a logistic regression with individual and time fixed effects. Household income was simplified into two categories to preserve cell sizes.

Conclusion

We find that there are two different experiences of being Financially Unhealthy. For nearly half of Americans (47%), lack of financial health is a long-term, chronic experience. For another third (36%), they are Financially Unhealthy intermittently, having favorable financial health in some years but not others. In this report, we defined a period of being chronically Financially Unhealthy as one where the individual lacked financial health for all years they were observed (in this case, for five years). We kept this high threshold because it provides a clear distinction between intermittent and chronic experiences of being Financially Unhealthy, but we acknowledge that someone who is Financially Unhealthy for four consecutive years may not be very different from those who lacked financial health in all five years. As more data becomes available, our threshold may prove to be too high and alternative definitions might warrant exploration. 

Even with our high threshold, we find meaningful differences in who is chronically Financially Unhealthy across race and ethnicity, income, gender, education, and ability. Being chronically Financially Unhealthy is more often experienced by historically vulnerable groups, such as Black and Latinx Americans, women, those with household incomes less than $100,000, those with less than a bachelor’s degree, and those with a disability. With these findings, we join the chorus of those who  underscore the importance of developing policy solutions tailored to supporting the needs of those who are most vulnerable. 

By investigating life events associated with being chronically and intermittently Financially Unhealthy, we can begin to offer insights to policymakers while acknowledging that it will most likely take cross-sector interventions or strategies to move the needle on financial health. The similarities in the life events associated with chronically lacking financial health and becoming Financially Unhealthy intermittently suggest that policies and programs that reduce the risk of becoming Financially Unhealthy intermittently may also help reduce the risk of remaining so for long periods. For instance, employment status, income, health, experiencing a medical event, and holding different types of debt (e.g., automobile loans, student loans, or credit card balances) are all related to being Financially Unhealthy on both a chronic and an intermittent basis. There are likely other life events that may be relevant here but for which we do not have data.17

Given the overlap in the life events associated with both experiences of being Financially Unhealthy, a critical question is whether those who are intermittently Financially Unhealthy are at risk of becoming chronically so. Our analysis of five years of data likely underestimates this risk because some people who were Financially Unhealthy for a year or two at the end of the five-year period might be at the start of a long period of being Financially Unhealthy. What looks like an intermittent financial challenge for these people, such as a credit card debt or medical debt, could quickly escalate into a chronic issue. This underscores the importance of repeatedly collecting nationally representative data on Americans’ financial situations. Doing so as part of the Financial Health Pulse initiative shows the extent to which households struggle to plan, spend, borrow, and save, and it points to potential policy solutions to improve the financial health of all Americans.

Acknowledgments

The Financial Health Network is grateful for the support of numerous individuals and organizations.

We appreciate the support of Genevieve Melford, Shehryar Nabi, and Rachel Black at the Aspen Institute’s Financial Security Program. In addition, Marco Angrisani and Jeremy Burke at the University of Southern California provided generous research support.

Thank you to our colleagues at the Financial Health Network who contributed to this research, including Andrew Warren, Wanjira Chege, Angela Fontes, Dan Miller, Chris Vo, Michael Salmassian, and David Silberman.

The Financial Health Pulse is supported by the Citi Foundation, with additional funding from Principal® Foundation. 

Citi Foundation

Since the inception of the initiative in 2018, the Financial Health Network has collaborated with USC’s Dornsife Center for Economic and Social Research (CESR) to field the study to its online panel, the Understanding America Study. Study participants who agree to share their transactional and account data use Plaid’s data connectivity services to authorize their data for analysis.

USCDornsife

The findings, interpretations, and conclusions expressed in this piece are those of the Financial Health Network and do not necessarily represent those of our funders or partners.

Endnotes
  1.  Andrew Dunn, Necati Celik, Andrew Warren, & Wanjira Chege, “Financial Health Pulse: 2022 U.S. Trends Report,” Financial Health Network, September 2022.
  2.  Sam Bufe, Stephen Roll, Olga Kondratjeva, Stephanie Skees, & Michal Grinstein-Weiss, “Financial Shocks and Financial Well-Being: What Builds Resiliency in Lower-Income Households?,” Social Indicators Research, October 2021.
  3. Colleen M. Heflin, “The Role of Social Positioning in Observed Patterns of Material Hardship,” Social Problems, November 2017.
  4. Sicong Sun, Stephen P. Roll, Olga Kondratjeva, Sam Bufe, & Michal Grinstein-Weiss, “Assessing the Short-Term Stability of Financial Well-Being in Low- and Moderate-Income Households,” Washington University in St. Louis Social Policy Institute, March 2019.
  5. Robert L. Clark & Olivia S. Mitchell, “Americans’ financial resilience during the pandemic,” Financial Planning Review, May 2022.
  6. See more information on recruitment into the UAS panel.
  7. The final data file has 14,090 person-year records.
  8. In the 2022 Pulse survey sample, we did not find any statistically significant difference in financial health when comparing the weighted sample of respondents who participated in all five waves to the respondents who did not participate in all five waves. This suggests that those who answered all five waves of the survey had similar financial health to those who did not, meaning that possible bias in financial health due to attrition across waves was largely addressed by the longitudinal weights.
  9. The exact score range for Financially Vulnerable is between 0 and 39; for Financially Coping, it is between 40 and 79. In this study, we combine those whose scores are Financially Vulnerable or Financially Coping into a single tier (Financially Unhealthy) to focus on the processes that may lead to difficulties in a person’s ability to be resilient and thrive, as well as to differentiate between being chronically and intermittently Financially Unhealthy. It is possible that the processes and movement between financial health tiers may differ depending on the tier in which they started or ended.
  10. See our FinHealth Score methodology for more details.
  11. The data for those who were Financially Unhealthy for five years are fully censored, meaning that they could have become Financially Unhealthy earlier than 2018 and could remain Financially Unhealthy after 2022.
  12. We find that being chronically Financially Unhealthy is not synonymous with being Financially Vulnerable and that being intermittently Financially Unhealthy is also distinct from Financially Coping (see Tables A2 and A3 in the Appendix, found in the PDF version of this report). Among those who were chronically Financially Unhealthy, 69% to 77% were Financially Coping between 2018 and 2022. Similarly, among those who were intermittently Financially Unhealthy, 44% to 60% were Financially Coping and between 33% to 53% were Financially Healthy over the same time period.
  13. We used the demographic characteristics of respondents as reported in the 2022 survey. People who identified their race as White, Black, or Asian only and their ethnicity as non-Hispanic were categorized respectively. People who identified their ethnicity as Hispanic were categorized as Latinx. People who identified with other races (Pacific Islanders, Native Hawaiians and Alaska Natives, and American Indians) as well as people who identified with multiple races are not included in this analysis due to very small sample sizes.
  14. The Pulse survey collects information on those who identify as nonbinary, gender nonconforming, or genderqueer, but there were too few individuals in the sample to confidently interpret results. In addition, our survey began asking respondents to self-identify with these options starting in 2021, so we lacked data for three of the five years covered in this study. We use the gender identity of the respondent, even though we know financial decisions are often made at the household level.
  15. In this study, “always being married or living with a partner” means that they reported either of these two relationship statuses for all five years of the Pulse study.
  16. Note that these associations do not suggest a clear path of causality between being Financially Unhealthy and different experiences. For instance, numerous studies have concluded that financial challenges are a major source of stress for households, which can affect their physical and mental well-being. On the other hand, an unexpected major medical event can wreak havoc on people’s finances. Without knowing when such an event might have occurred and when the financial health tier changed, it is not possible to establish the direction of causality.
  17. See the Aspen Institute’s blog post “Five Lessons About Financial Well-Being” for more research on factors contributing to financial health.

Written by

Necati Celik

Manager, Policy and Research
Financial Health Network

Kennan Cepa, Ph.D.

Senior Manager, Policy and Research
Financial Health Network