FinHealth Spend Report 2024

U.S. Spending on Interest and Fees Tops $400 Billion
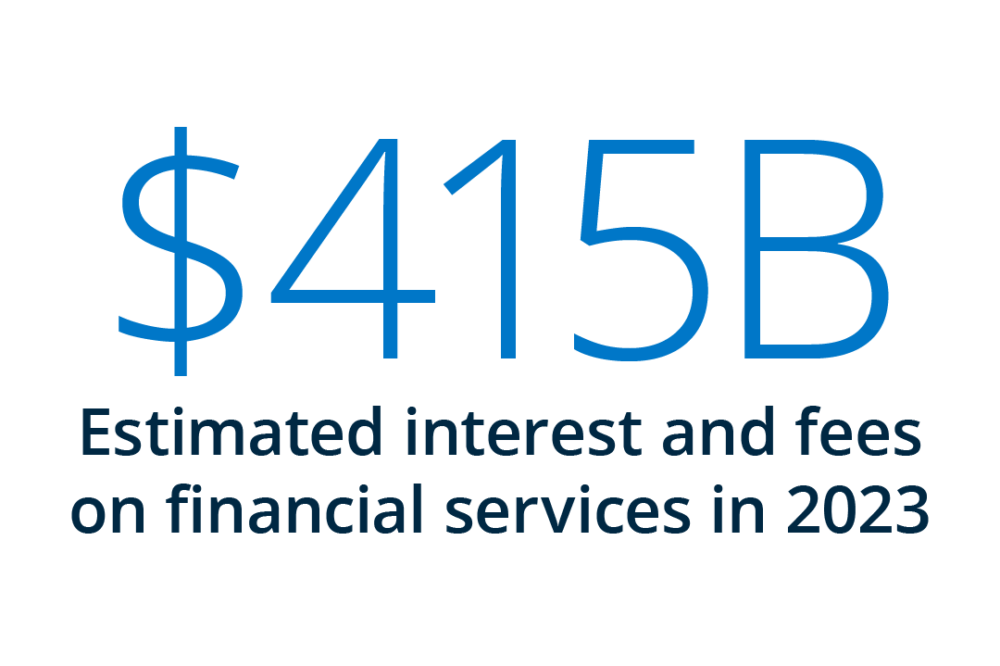
2023 was a year characterized by opposing forces: inflation slowed and real wages grew, yet interest rates remained high. How has spending on financial services changed against this backdrop? This year’s FinHealth Spend Report – our long-running national study on the costs of financial services to U.S. households – reveals that spending jumped 17%, reaching an all-time high of $415 billion. Our analysis shows that Americans are carrying higher credit balances, paying higher interest rates, and increasingly holding more debt than is manageable – signaling a growing financial burden that weighs most heavily on vulnerable households.

Total spending increased 17% to reach a record $415 billion

The percentage of households holding an unmanageable amount of debt increased from 26% to 28%

Financially Vulnerable households spent 16% of their income on interest and fees on average

Consumer spending on overdraft fees decreased by $2.9 billion from 2020 to 2023
Estimated spending on bank account fees dropped by 10% in 2023.
Total spending on bank account fees, in billions.
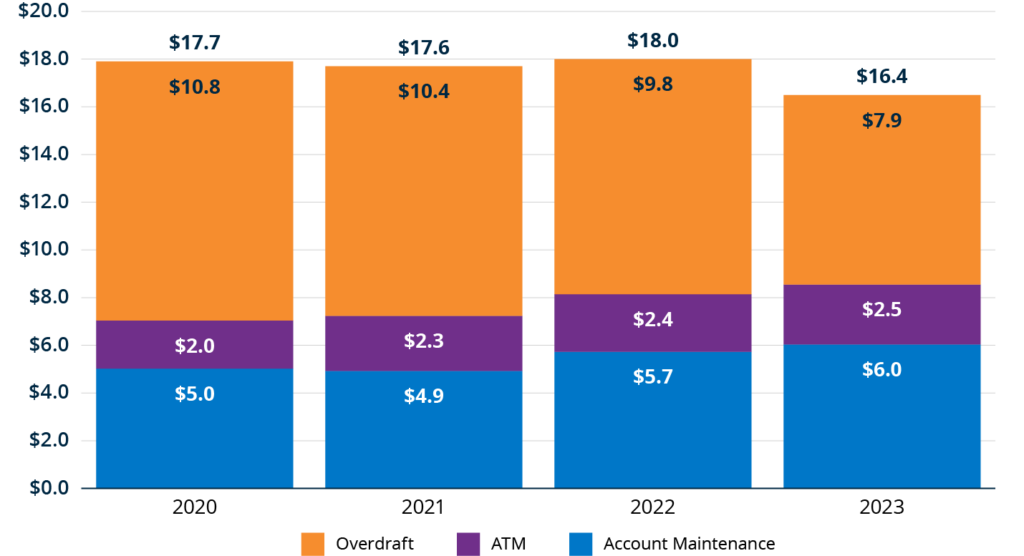
Total revenue from overdraft/nonsufficient funds (NSF) fees continued to contract, from an estimated $9.8 billion in 2022 to $7.9 billion in 2023.1 In contrast, annual revenue from account maintenance and ATM fees has increased by an estimated $1.6 billion since 2020. However, this does not fully counterbalance the decline in overdraft/NSF fees.
Overall bank account fees, including overdraft/NSF, account maintenance, and ATM fees, have decreased from an estimated $17.7 billion in 2020 to $16.4 billion in 2023.
Interest and fees from revolving general-purpose credit card balances continue to grow.
Total interest and fees from revolving general-purpose credit card balances, in billions.
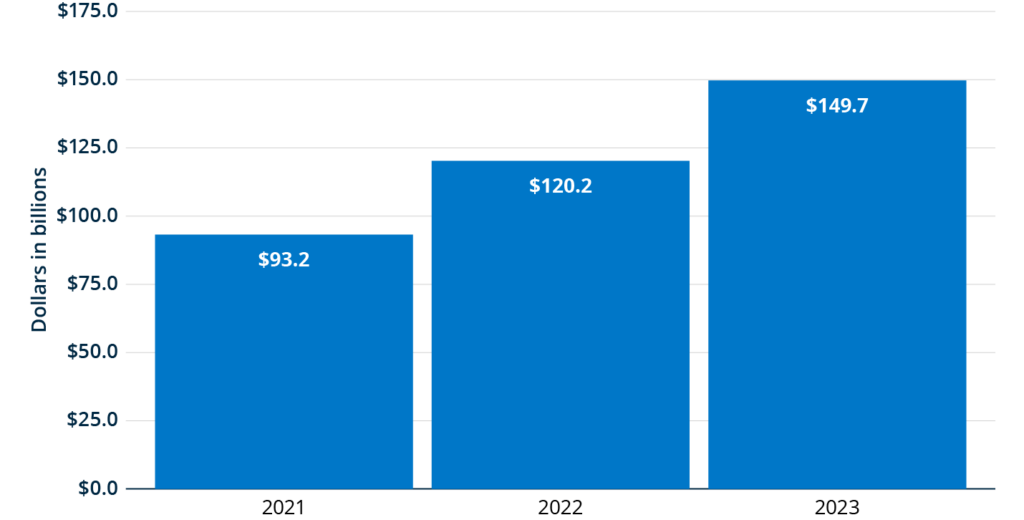
The combination of rising credit balances and rising interest rates increased costs for consumers who carried a balance from month to month in 2023. Consumers who carried balances on general-purpose credit cards paid an estimated total of $150 billion, up approximately $30 billion from the prior year and more than $50 billion from 2021.
Notably, the proportion of respondents with revolving credit card debt who said they had unmanageable debt increased from an estimated 38% in 2022 to 42% in 2023.
Higher interest rates drove an increase in auto spending.
Total interest revenue from car loans for new and used cars, in billions.
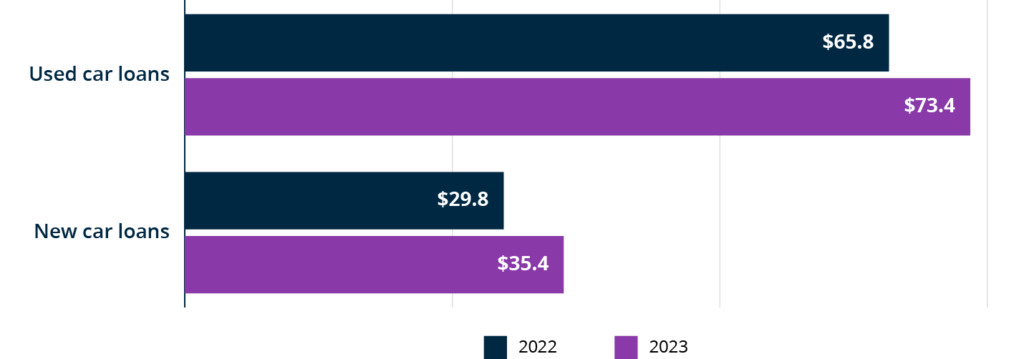
Despite slightly lower average auto loan amounts, elevated interest rates and slightly shorter average loan terms contributed to higher monthly payments for borrowers in 2023.2
Total estimated interest from auto loans for new and used cars topped $100 billion for the first time, with about two-thirds (67%) of the total coming from auto loans for used vehicles. Total interest payments for new car loans also expanded from an estimated $29.8 billion in 2022 to $35.4 billion in 2023.
Spending on installment loans continues to expand.
Total interest and fees from unsecured installment loans, in billions
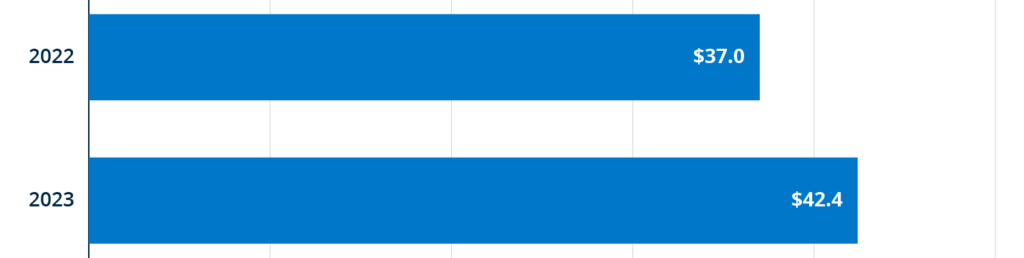
Total interest and fees from unsecured installment loans expanded from an estimated $37.0 billion in 2022 to $42.4 billion in 2023. However, we find a 3 percentage point decrease in the portion of households using installment loans – from 13% in 2022 to 10% in 2023.3
This decrease in originations may have been offset by higher loan balances. Average loan balances per borrower increased in 2023 to record-high levels, with the increase particularly pronounced among borrowers with credit scores near the top of the score range.4
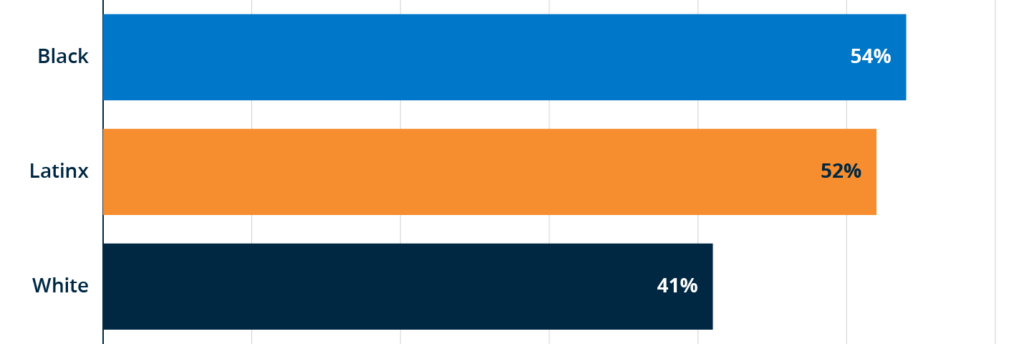
Loan holders of color were more likely to report difficulty in making payments.
Percentage of federal student loan borrowers who said it was at least somewhat difficult to make their loan payments, by race and ethnicity.
Total estimated fees and interest on federal student loans doubled from $8.3 billion in 2022 to $16.6 billion in 2023, which corresponds with the resumption of federal student loan payments on October 1, 2023.5 Private student loan payments also expanded from an estimated $8.9 billion in 2022 to $11.0 billion in 2023, coinciding with increased interest rates for those with variable-rate loans.
As payments resumed, nearly half (46%) of federal student loan holders said that it was somewhat or very difficult to meet their student loan obligations.6 Loan holders of color were more likely to report difficulty, with 54% of Black and 42% of Latinx borrowers saying it was at least somewhat difficult to make their payments compared with 41% of white borrowers.
Households of color are more likely to use alternative credit products than white households.
Percentage of households that reported use of select alternative credit products over the last 12 months, by race and ethnicity.
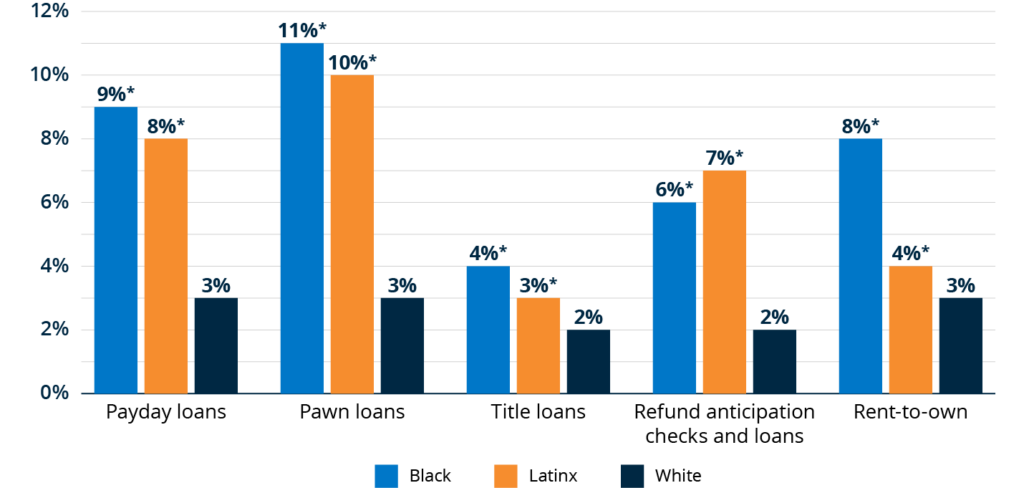
Note: * Statistically significant difference (p < 0.05) relative to white households.
Although usage of alternative financial services appears to have stabilized in 2023, communities of color continue to use alternative credit products at disproportionately higher rates. For example, Black and Latinx households each reported using pawn loans at more than three times the rate of white households in 2023.
Overall, interest and fee revenue for these products increased by an estimated 4% between 2022 to 2023, which is slower than the 9% increase seen between 2021 and 2022.
Spending Disparities From 2022 Still Remain
Disparities by race and ethnicity and financial health tier remain at similar levels to prior years. Black, Latinx, and Financially Vulnerable households continue to pay more in interest and fees, as well as a greater share of their income, than white and Financially Healthy households, demonstrating that rising credit balances and interest rates are falling heavily on those who are less equipped to pay for them. For example, Financially Vulnerable households accounted for more than a quarter (27%) of the total spent on interest and fees in 2023, despite constituting only 15% of our survey sample. As economic uncertainties persist, it’s critical to understand the impact on those who struggle the most and work toward providing equitable solutions.


Life Insurance in America: Understanding and Closing Coverage Gaps
Many families lack any life insurance. Who holds life insurance, who should own it, and what can we do to better protect families?

FinHealth Spend Research
The FinHealth Spend Research estimates how much U.S. households pay each year for dozens of financial products and services, such as overdraft, credit cards, and auto loans.
FinHealth Spend Report 2024
Explore the trends. Discover new insights. Build stronger strategies.