FinHealth Spend Report 2023

U.S. Spending on Interest and Fees Soars
What are Americans paying for financial services as the country emerges from the COVID-19 pandemic? This year’s FinHealth Spend Report – our long-running national study on the costs of financial services to U.S. households – reveals that spending has soared in the past year amid a turbulent economy and persistent inflation. Our analysis shows that Americans are rapidly accruing debt, increasingly turning to high-cost credit options, and beginning to default on credit balances,1 all of which could signal serious economic trouble for many households in the coming year.
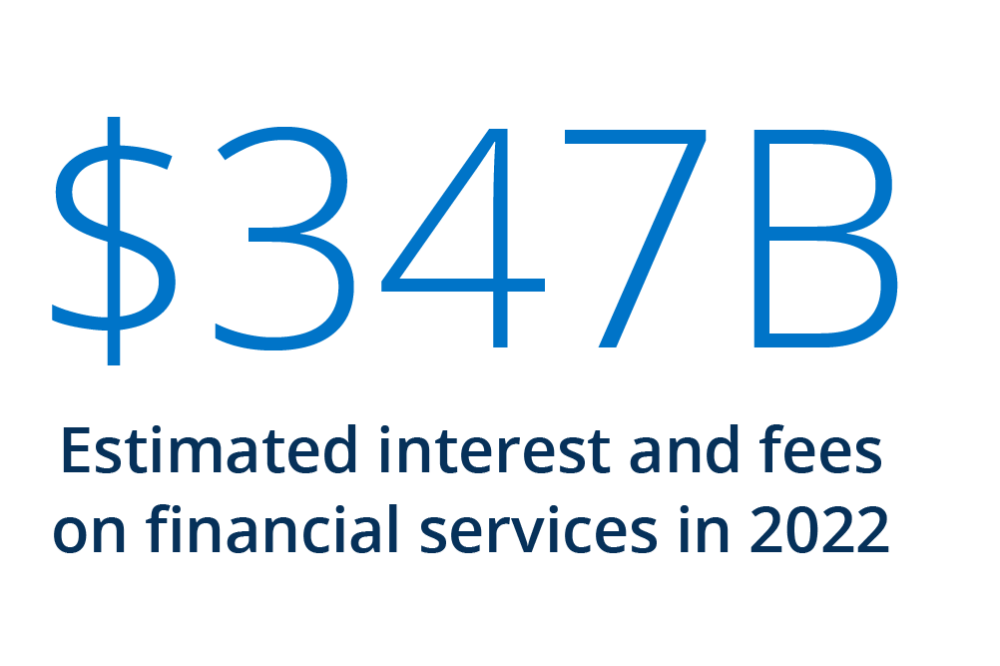

Finding 1: Total spending rose 14% to reach a record $347 billion

Finding 2: Interest and fees on credit card balances alone grew an estimated $20 billion in 2022, as balances spiked and interest rates rose

Finding 3: Financially Vulnerable households are spending 14% of their income on fees and interest alone

Finding 4: 2022 saw a startling increase in high-cost alternative credit use, driven mostly by populations of color
The percentage of unbanked households fell in 2022.
Percentage of U.S. households that are unbanked, by year.
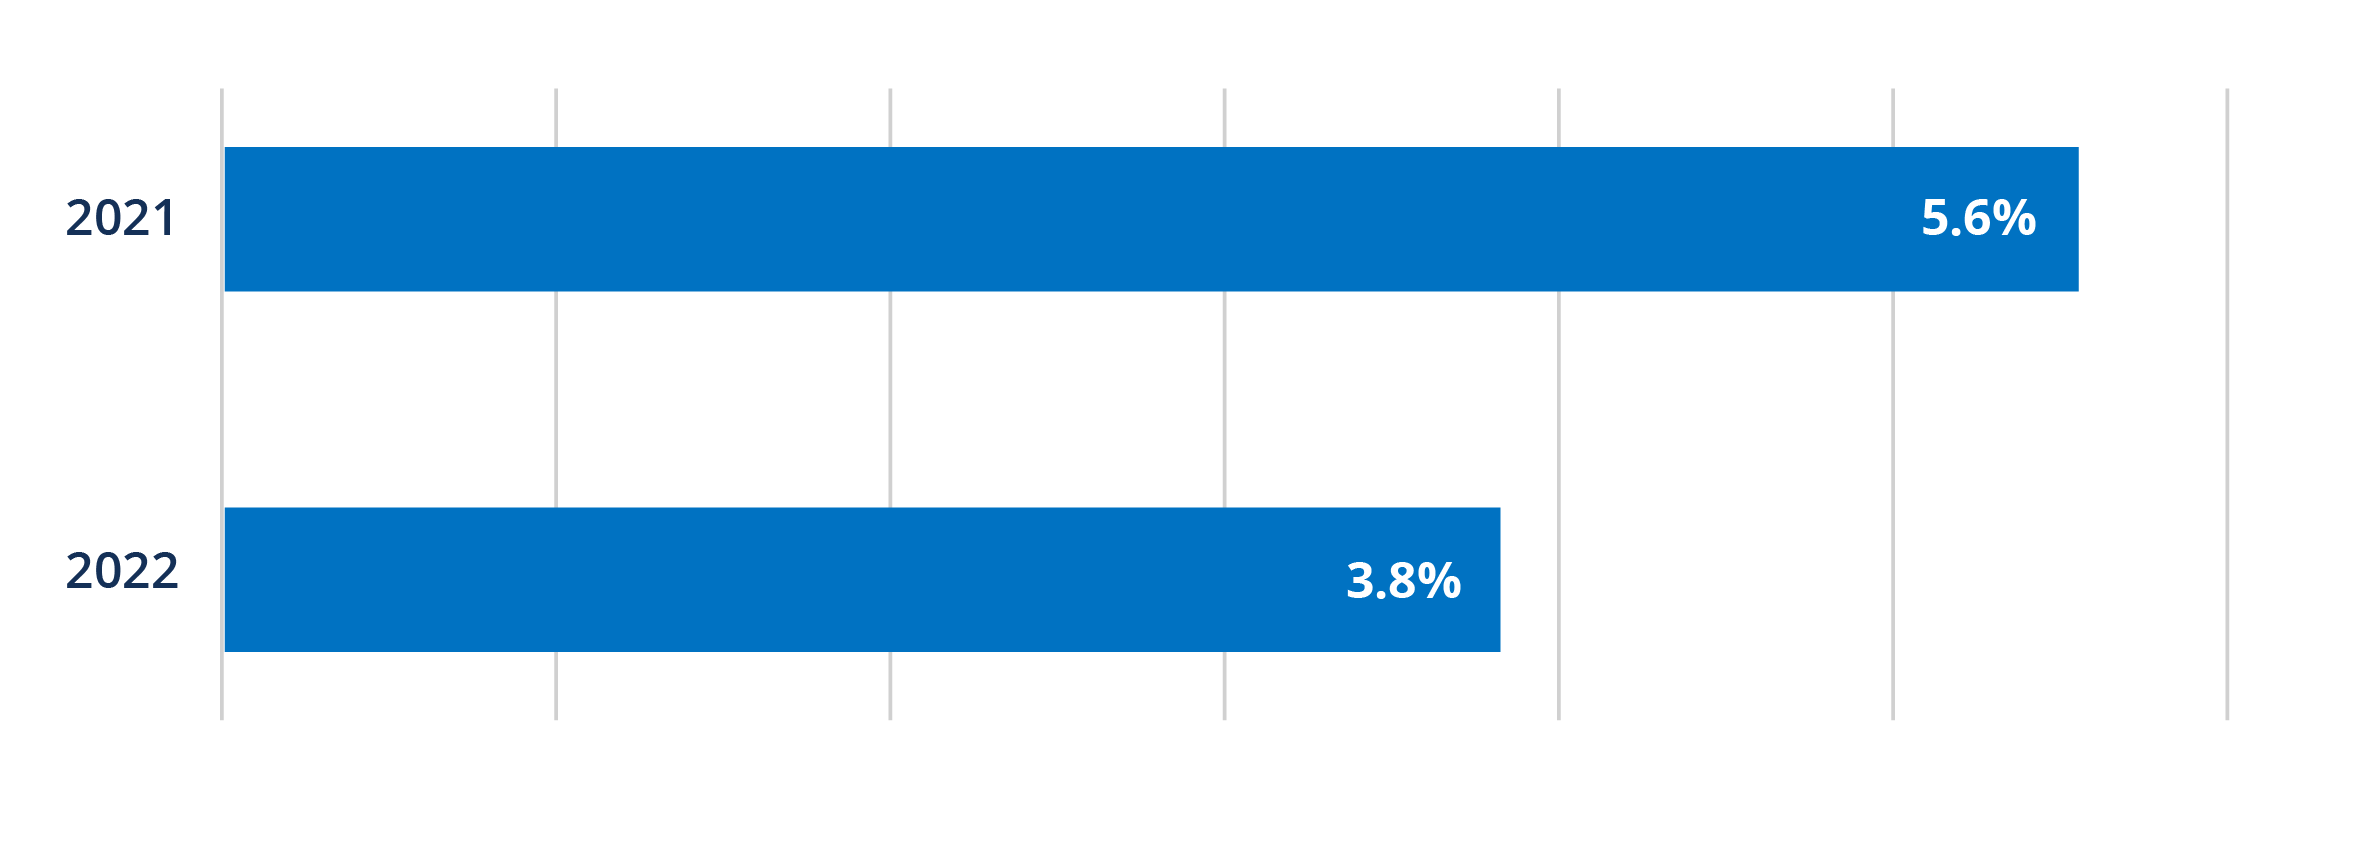
The proportion of the population without a checking or savings account declined in 2022, dropping among surveyed households from 5.6% in 2021 to 3.8% in 2022. Government benefits (e.g., a stimulus payment or unemployment benefit) during the pandemic were a major contributor to this financial inclusion, according to a recent FDIC analysis.2 Despite this statistically significant drop in the percentage of unbanked households, stark disparities remain, with the majority of the unbanked composed of people of color.
We also find continued evidence that being “banked” is not a static experience: 12% of households who don’t have a checking account reported that they had closed one in the past 12 months.
Overdraft/NSF fees continued to decline in 2022.
Total estimated overdraft/NSF fees, in billions.

Industry reforms are fueling a continued dip in overdraft spending, which declined from an estimated $10.6 billion in 2021 to $9.9 billion in 2022 – a dramatic drop compared to pre-pandemic estimates of $15.5 billion. Numerous financial institutions have made adjustments to their overdraft policies in the last two years, with some eliminating overdraft altogether.3 Fees from smaller banks (assets under $1 billion) and credit unions have also dropped since before the pandemic, but are estimated to have rebounded somewhat over the past year, suggesting that larger banks have been more active in reforming overdraft policies than smaller institutions.
Although total bank overdraft/NSF revenue declined, the percentage of households reporting that they paid an overdraft fee held constant (17%). One in five respondents who overdrafted reported paying six or more overdraft fees in 2022 – with total fees reaching into the hundreds of dollars.

Product Spotlight: Overdraft Trends Amid Historic Shifts
Which Americans are most impacted by overdraft fees? Our FinHealth Spend Product Spotlight takes a deeper look at the state of overdraft today, the consumers who use it, and potential implications for financial institutions and policymakers. Read the full brief.
Revenues from alternative credit products increased compared with pandemic years.
Total estimated interest and fees on various credit products, in billions.

Following years of declines, we project that interest and fees for payday loans, pawn loans, auto title loans, and other forms of alternative credit increased in 2022. While data for this category of financial services is sparse, we estimate that spending rose to nearly $11 billion in 2022 from $9.3 billion in 2021.
Increased usage of alternative credit products was driven almost exclusively by households of color, particularly Black households. These findings suggest that Black households are struggling to make ends meet, with limited options for affordable credit.
Nearly half of Financially Vulnerable cardholders have $5,000 or more in credit card debt.
Proportion of cardholders with credit card debt of $5,000 or more, by financial health tier.

Total interest and fees from revolving balances on general purpose credit cards skyrocketed more than 20% in 2022, reaching an estimated $113.1 billion. This increase reflects both elevated card balances and higher variable interest rates. We roughly estimate that increases in APRs account for at least $5 billion of the increase in total interest and fees from general purpose card balances.
Just over half of general purpose credit card users report having carried a balance in 2022, with clear delineations by financial health tier. Three-quarters (75%) of Financially Healthy cardholders say they never carry a balance, compared with just 10% of Financially Vulnerable cardholders. In addition, 46% of Financially Vulnerable cardholders are carrying more than $5,000 in credit card debt, far higher than Financially Healthy cardholders. This means that elevated interest rates are impacting consumers who are already struggling in a disproportionate way.

As the availability of buy now, pay later (BNPL) continues to grow, regulators and consumer advocates have voiced a host of risks, including “loan stacking” and potential consumer overindebtedness.4 Our 2023 report begins to paint a better picture of who is using BNPL and the potential pitfalls they face.
- 14% of households used a pay-in-4 BNPL service in 2022
- 24% of Black households, 18% of Latinx households, and 11% of White households used BNPL last year
- About 1 in 5 users said they’d made six or more BNPL purchases in the prior 12 months, and one-third (33%) said they had made two or more BNPL purchases in the prior month
A deeper analysis of the BNPL market is expected later this year.
Fees and interest on federal student loans remain at levels far below pre-pandemic.
Estimated interest and fees from student loans by type, 2019-2022, in billions.
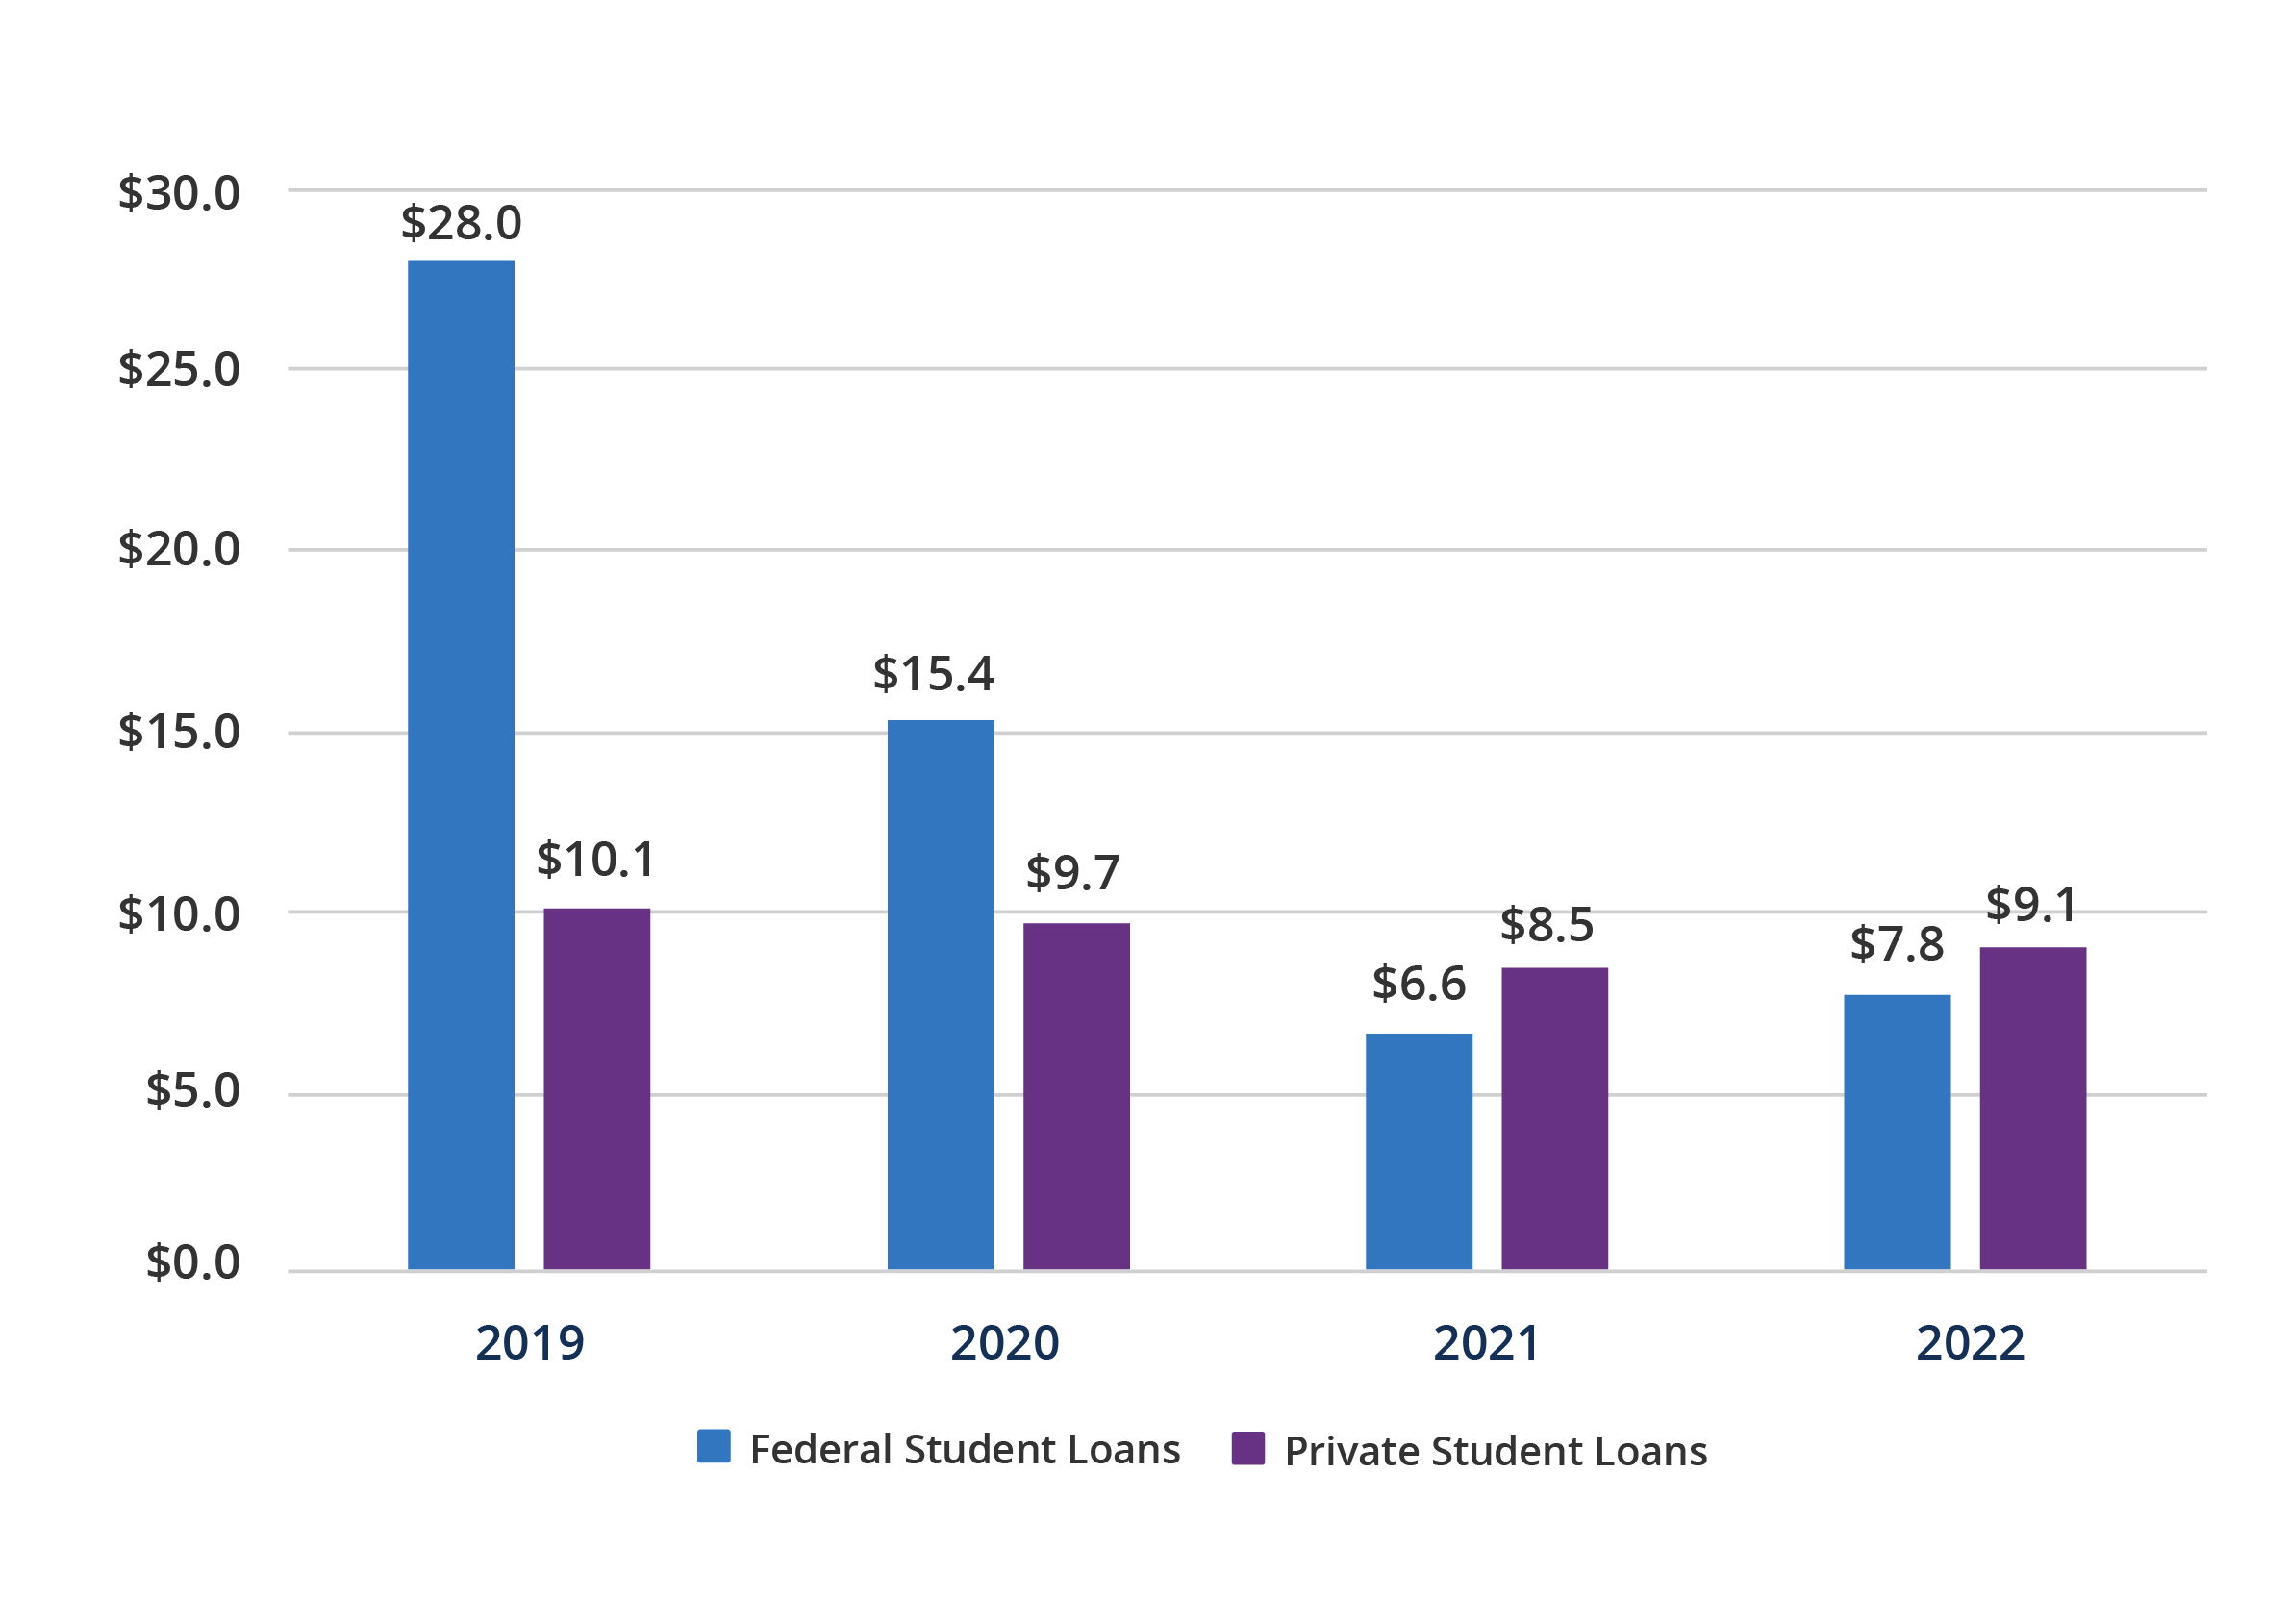
Total interest and fees for federal student loans in 2022 remained far below pre-pandemic levels, – an estimated $7.8 billion, compared with $28 billion in 2019 – as the student loan moratorium was extended for the duration of the year.5
Despite comprising just 7% of the total outstanding student loan portfolio, total interest and fees from private student loans outpaced federal student loans, reaching an estimated $9.1 billion in 2022.6
Historically high auto prices drove an increase in auto loan spending in 2022.
Total interest revenue from new and used auto loans, by year.

Spurred on by all-time highs in vehicle pricing, spending on used auto loans soared to an estimated $66.4 billion in 2022 – a nearly $10 billion increase from 2021. Overall interest on new auto loans also grew, reaching $30.4 billion.
As of the end of 2022, monthly car payments on newly originated loans were more than 25% higher than they were at the close of 2019, raising questions about borrowers’ ability to manage their payments. Toward the end of the year, delinquencies surpassed pre-pandemic levels.7
Installment spending expanded dramatically in 2022.
Estimated interest on bank and non-bank installment loans, by year.
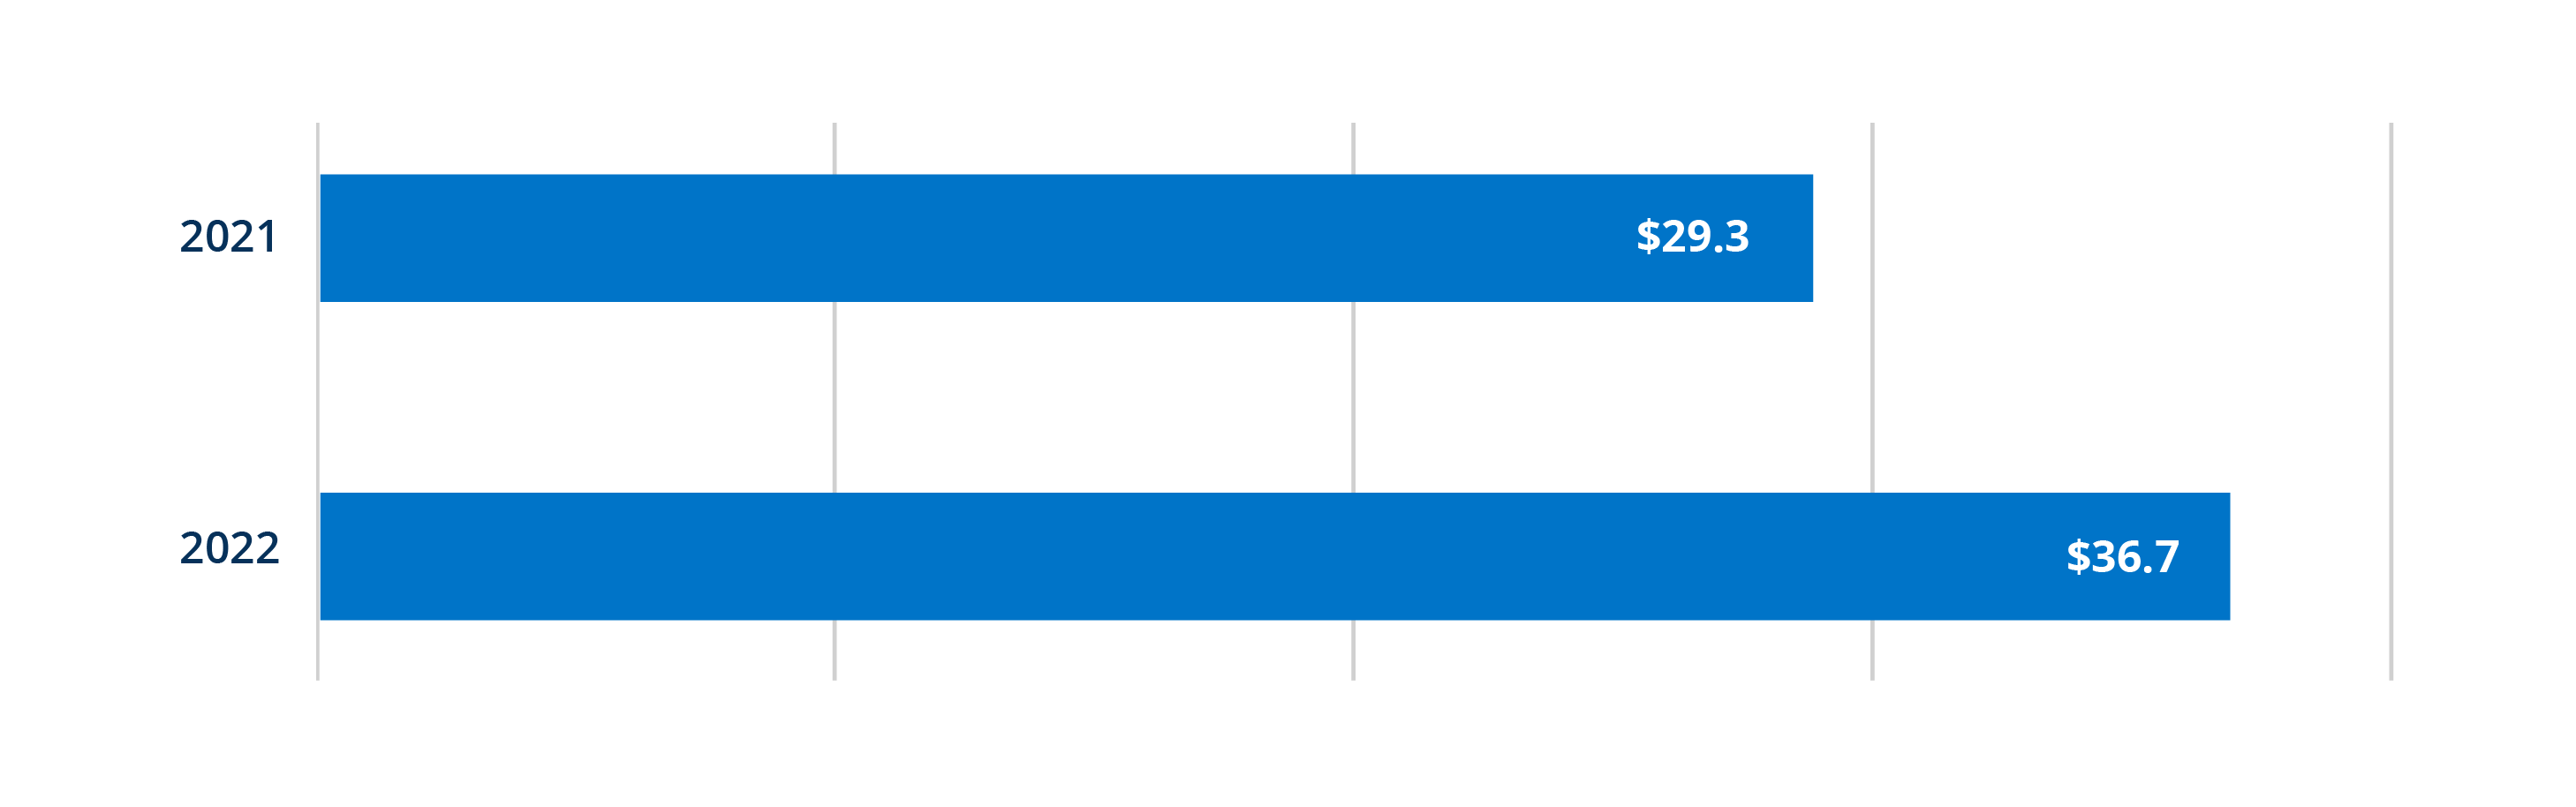
Total spending on unsecured installment loans jumped by 25% in 2022, totaling an estimated $36.7 billion.8 This is largely attributable to an increase in the number of loans and the average loan size, rather than interest rate hikes. Similar to auto loans, delinquencies for these loans also surpassed pre-pandemic levels.9
While both bank and nonbank installment lending is on the rise, households of color are driving the vast majority of nonbank installment loan use.
Spending Disparities Persist by Race, Ethnicity, and Financial Health Tier
Consistent with prior FinHealth Spend reports, we find that Black and Latinx households, as well as Financially Vulnerable households, pay steeper prices for the financial services they use – despite lower average incomes than White and Financially Healthy households. For example, Financially Vulnerable households drove 28% of all fees and interest, despite only comprising approximately 15% of the population. As Americans everywhere face an increasingly uncertain economy, our study raises important questions about equitable access to affordable and appropriate financial services.

Overdraft Trends Amid Historic Policy Shifts
Overdraft and non-sufficient funds (NSF) fees remain a reality in America’s modern banking system, but the landscape is rapidly evolving. This FinHealth Spend Product Spotlight sheds light on the state of overdraft today, the consumers who use it, and potential implications for financial institutions and policymakers.

Cryptocurrency Kicks Off 2023 With Decline in Ownership
A new Financial Health Network survey finds remaining owners appear to hold crypto as part of a larger investment strategy; holdings are now lowest among Black investors.

FinHealth Spend Research
The FinHealth Spend Research estimates how much U.S. households pay each year for dozens of financial products and services, such as overdraft, credit cards, and auto loans.

Buy Now, Pay Later: Implications for Financial Health
In this brief, we leverage findings from a nationally representative survey to better understand the buy now, pay later (BNPL) market, the users who are driving it, and the implications for their financial health.
Acknowledgments
We are grateful for the thoughtful and numerous contributions of Hannah Gdalman, the strategic guidance and leadership from David Silberman and Angela Fontes, and the input of so many colleagues at the Financial Health Network, including Fawziah Bajwa, Tanya Ladha, Dan Miller, Michael Salmassian, Lindsey Taureck, and Chris Vo.
We appreciate the invaluable insights on market trends provided by numerous experts across the financial services spectrum, including those from the Consumer Financial Protection Bureau (CFPB), the Federal Deposit Insurance Corporation (FDIC), the Financial Technology Association, H&R Block, Navient, Pew, Self-Help, the Student Borrower Protection Center, and the U.S. Department of Education. Arjan Schütte from Core Innovation Capital provided feedback on a draft of this paper. The report also benefited from the review of Carolina Souza and Paula D’Ambrosa at Prudential Financial.
Marco Angrisani, Jill Darling, Tania Gutsche, and Bart Orriens from the USC Dornsife Center for Economic and Social Research (CESR) provided valuable input throughout this project.
This report is made possible through the financial support of Prudential Financial.
![]()
FinHealth Spend Report 2023
Explore the trends. Discover new insights. Build stronger strategies.