Wall Street to Main Street: Who Accesses Non-Retirement Investment Accounts?
A new FinHealth Spend Product Spotlight reveals disparities in ownership of these wealth-building tools.

How Common Are Non-Retirement Investment Accounts?
In 2023, about three in 10 households (29%) held a non-retirement investment account.7
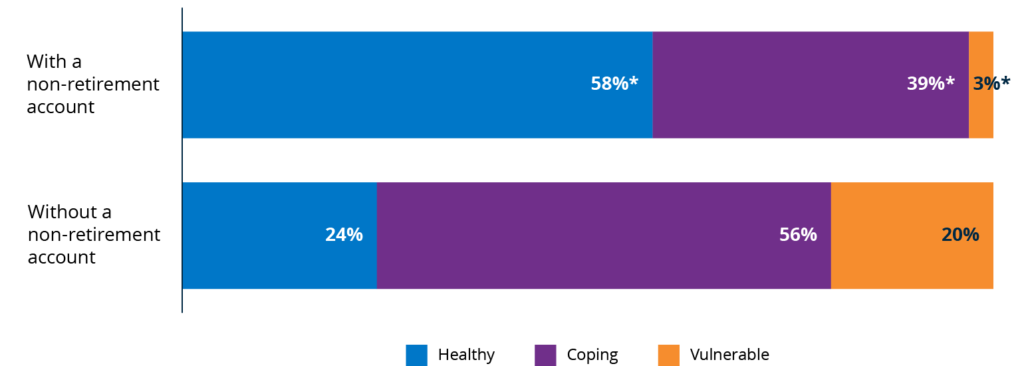
The households with non-retirement investment accounts were Financially Healthy – that is, able to spend, save, borrow, and plan in ways that increase their financial resilience and opportunity – at far higher rates than those without such investments (58% vs. 24%).8 They also tended to have much higher incomes than those without non-retirement investment accounts. Over half (53%) of non-retirement investors had household incomes of $100,000 or more, compared with just 19% of those without non-retirement investment accounts.
Figure 1. The majority of non-retirement investment account holders are Financially Healthy.
Households with non-retirement accounts compared with those without accounts, by financial health and household income.
Financial health, by non-retirement account ownership
Household income, by non-retirement account ownership
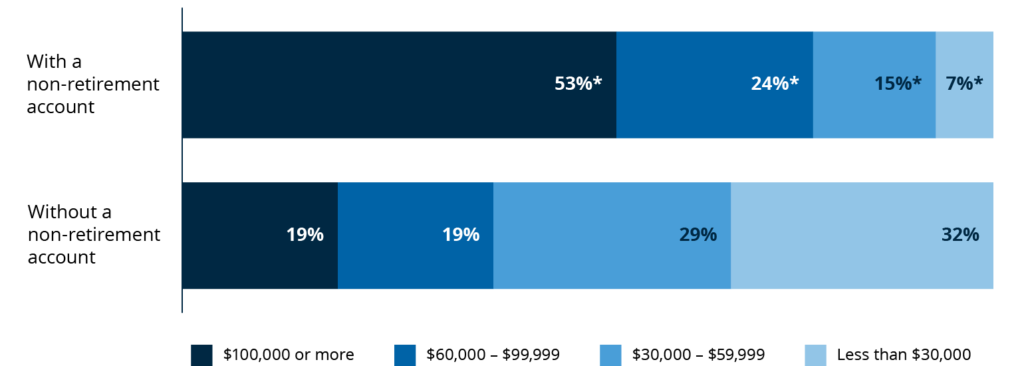
Note: *Statistically significant relative to households without a non-retirement account (p<0.05). The sample includes 1,965 households with non-retirement accounts and 3,332 households without non-retirement accounts selected based on their responses to the question, “Do you or anyone in your household have any of the following retirement or other savings or investment accounts?: Investment account you opened for the purpose of investing in the stock market, either through a traditional broker or an online platform.”
The vast majority of households with non-retirement accounts held them as part of a broader investing portfolio. For example, 93% of households with a non-retirement account also had either an employer-provided retirement savings account or an individual retirement account, and 57% owned both (Figure 2).9 In contrast, only 55% of those without non-retirement accounts had either an employer-provided or individual retirement account, and just 14% had both of those products. These data suggest that most people with non-retirement accounts use them as a supplement to investments that offer tax benefits, such as a 401(k), in line with popular financial guidance.10
Figure 2. Most non-retirement investment account holders also have other stock market exposure.
Households with non-retirement investment accounts compared to those without accounts, by retirement account ownership.
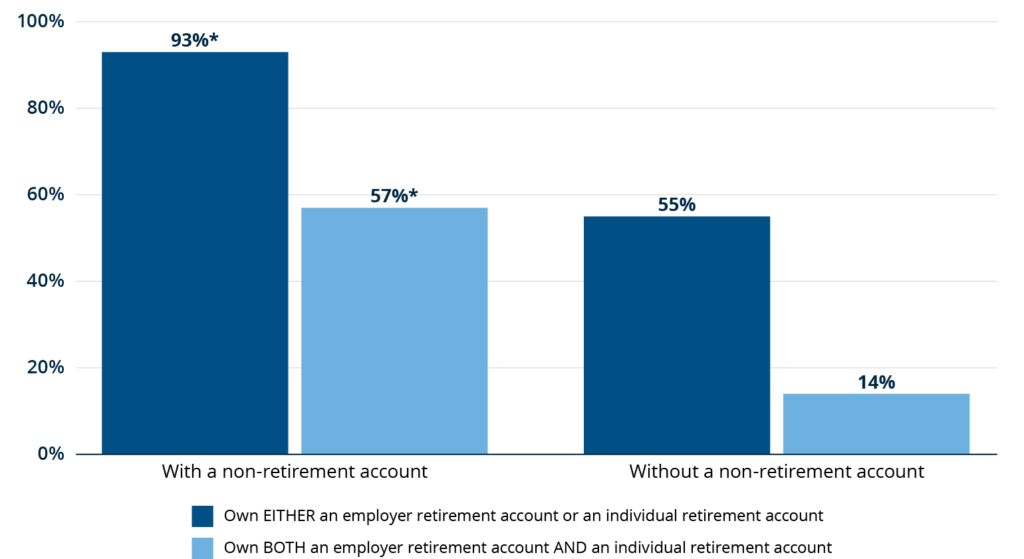
Note: *Statistically significant relative to households without a non-retirement account (p<0.05). The sample includes 1,965 non-retirement account holders and 3,332 who did not hold these accounts.
How Do Black and Latinx Non-Retirement Investors Differ From White Investors?
Consistent with other research, we find dramatic racial and ethnic disparities in non-retirement investment account ownership. Just 1 in 7 Black households and 1 in 5 Latinx households held a non-retirement investing account in 2023, compared with 1 in 3 white households (Figure 3).11 More than half of Asian households reported holding non-retirement accounts, the highest level of any group analyzed.12 Notably, significant differences by race and ethnicity hold even after controlling for age and household income.
Figure 3. Only 1 in 7 Black families have a non-retirement investment account.
Ownership of non-retirement investment accounts, by race and ethnicity.
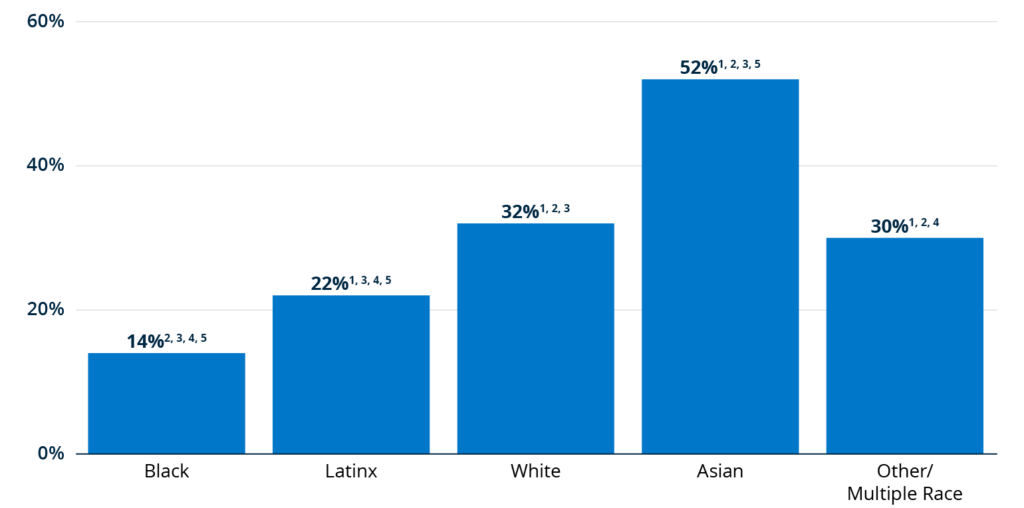
Notes: Sample includes 3,604 white households, 510 Black households, 706 Latinx households, 346 Asian households, and 301 households reporting other/multiple races.
1 Statistically significant difference relative to Black households (p <0.05).
2 Statistically significant difference relative to Latinx households.
3 Statistically significant difference relative to white households.
4 Statistically significant difference relative to Asian households.
5 Statistically significant difference relative to other / multiple race households.
Our analysis finds additional important differences between Black and Latinx non-retirement investors as compared with white investors. For example, less than half of Black and Latinx non-retirement investors (46%) were Financially Healthy, compared with 62% of white non-retirement investors.13, 14 Further, only 66% of Black and Latinx non-retirement investors said they had positive net worth, compared with 90% of white non-retirement investors.15
Our data therefore suggest that Black and Latinx investors are more frequently engaging in non-retirement investing while continuing to struggle with other aspects of financial health, like managing debt or building short-term savings. This finding could be interpreted in multiple ways. On one hand, this approach could bring risk, given that financially insecure individuals may lack the resources to weather investing downturns. At the same time, it could also be a strategy to build wealth in lieu of other mechanisms with larger barriers to entry, such as homeownership. And while non-retirement investment accounts lack tax benefits, they offer more flexibility and liquidity, which may appeal to individuals who don’t want to lock up funds until retirement age.
We further find that Black and Latinx households had opened their non-retirement investments accounts more recently. After controlling for income and age, a significantly higher proportion of Black and Latinx account holders opened their account within the past three years (39%) than white account holders (26%). Starting to invest later in life means less time for investments to grow, hampering wealth creation.
Although our data do not allow us to explore investment account balances, research suggests that Black and Latinx non-retirement investors report much smaller account values than white investors. For example, Pew Research Center found that the median value of stocks, bonds, and mutual funds for white families in 2021 was $32,500, versus $6,400 for Black families and $5,000 for Latinx families.16