Financial Health Pulse® 2023 U.S. Trends Report


The share of Financially Vulnerable Americans grew to 17% in 2023 from 15% in 2022.

Black, Latinx, and younger Americans disproportionately experienced an increase in financial vulnerability.

47% of unbanked households were Financially Vulnerable.

Workers at businesses with less than 100 employees were Financially Vulnerable twice as often as those working for businesses with 500 or more employees.
The percentage of Financially Vulnerable Americans returned to pre-pandemic levels.
Figure 1. Percentage of people by financial health tier (2018-23).

Note: * Statistically significant relative to 2023 (p < 0.05).
-
- 17% of Americans were Financially Vulnerable in 2023, an increase from 15% in 2022.
- The share of Americans who were Financially Healthy or Financially Coping did not meaningfully change over the last year.
Declines were observed across all four pillars of financial health: Spend, Save, Borrow, and Plan.
Figure 2. Percentage point change in positive responses for each financial health indicator (2022-23).
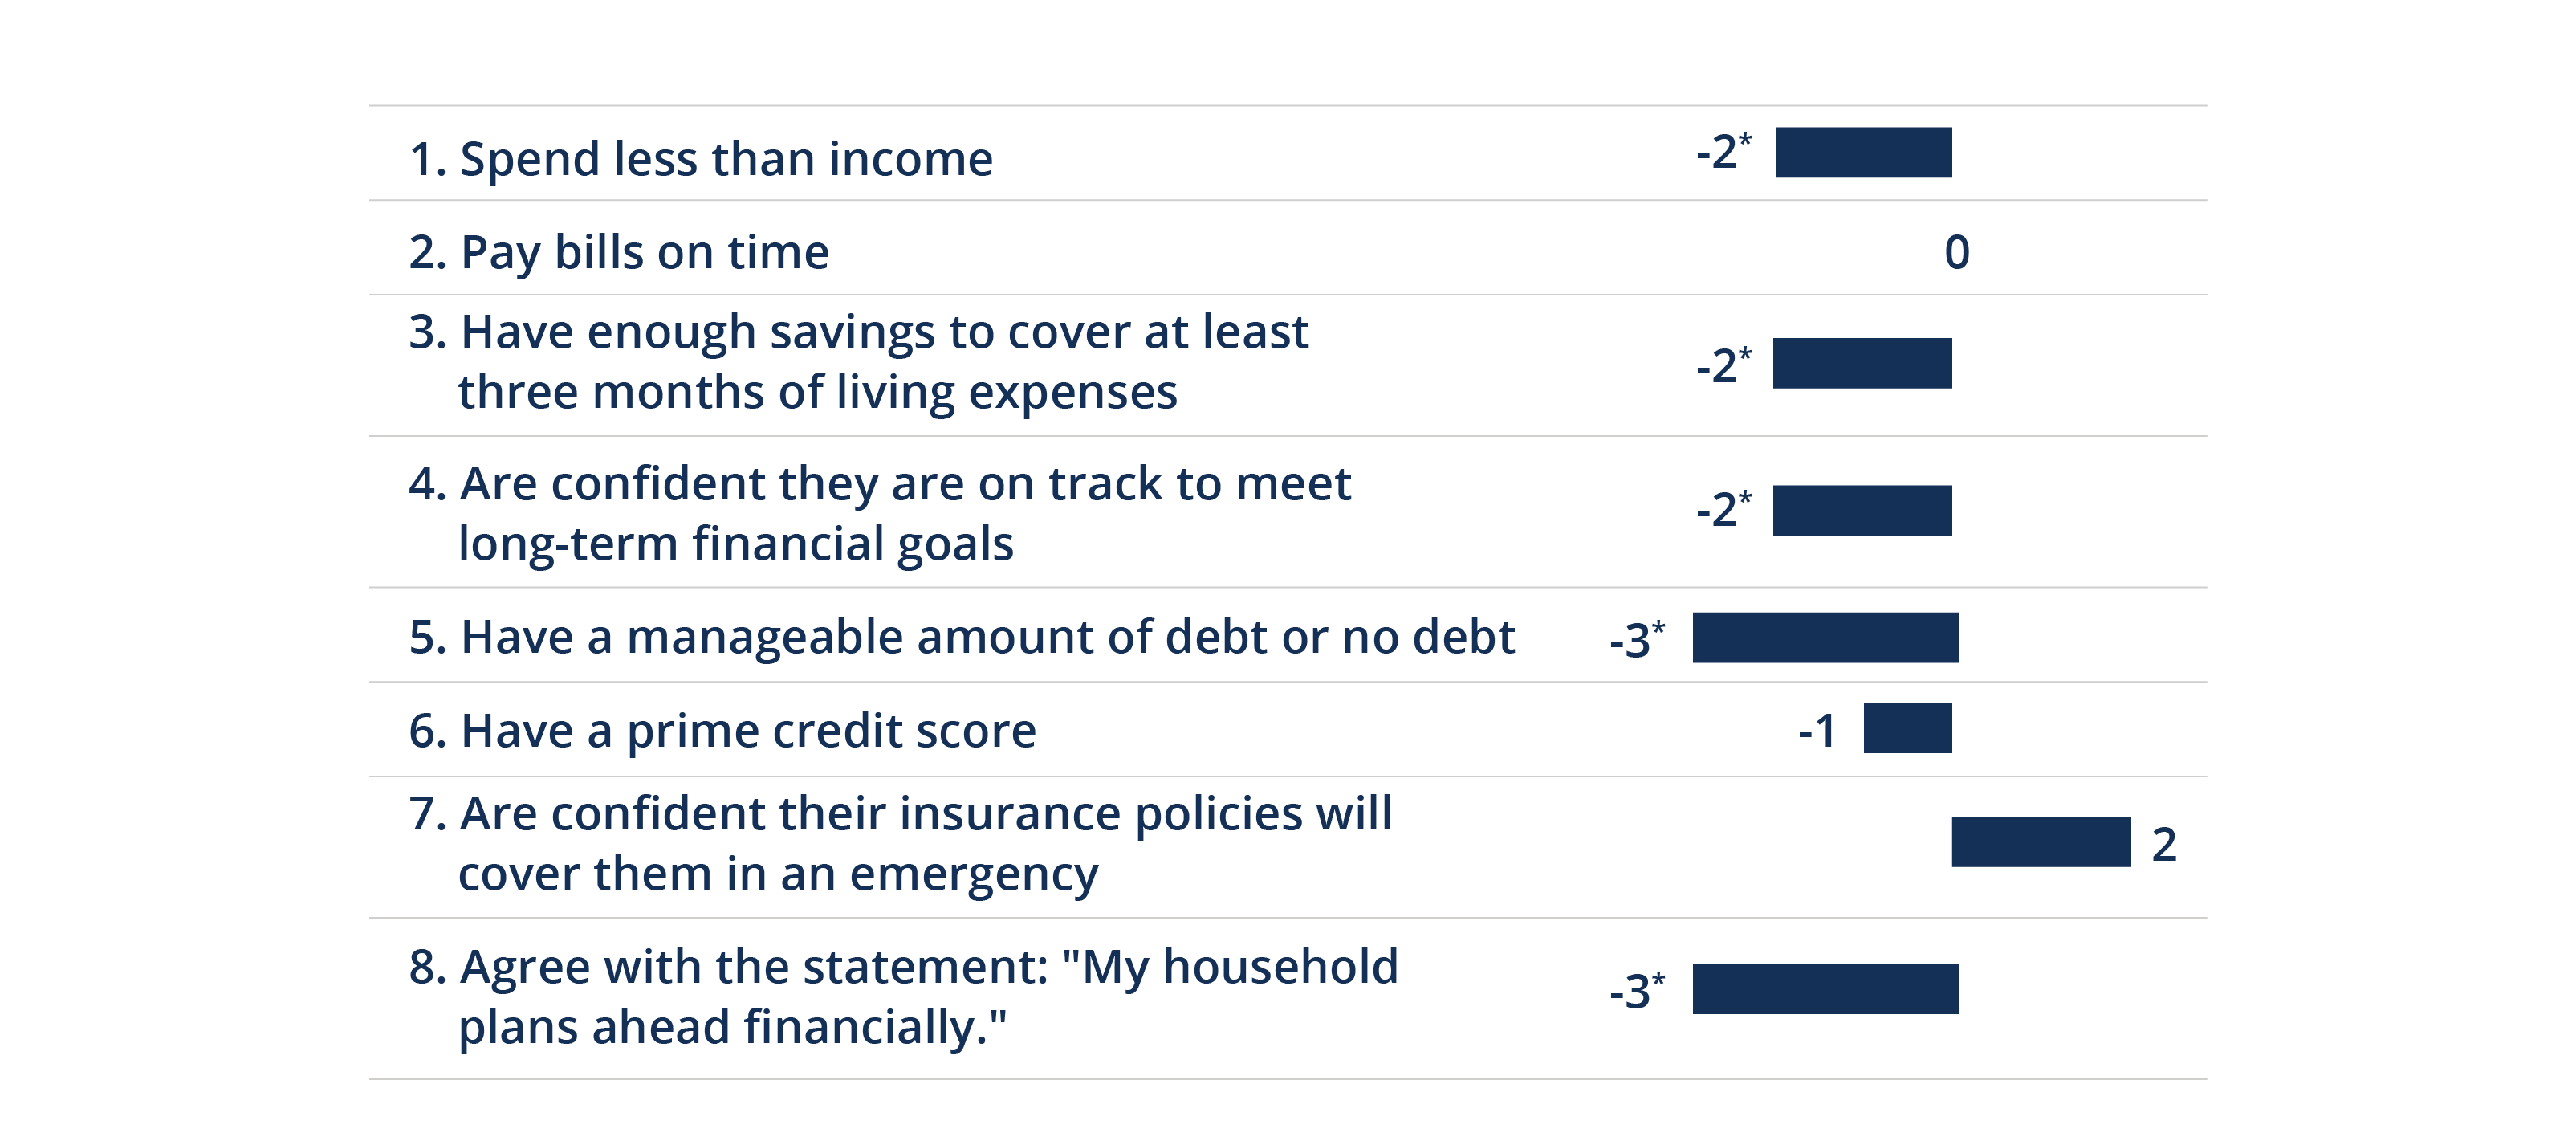
Note: * Statistically significant relative to 2022 (p < 0.05).
-
- With about half (49%) of Americans spending less than their incomes, this indicator is the lowest it’s been since we first began reporting on financial health in 2018.
- Three more indicators retreated to pre-pandemic levels: debt manageability, confidence in achieving long-term financial goals, and agreement that one’s household is planning ahead.
- Short-term savings also declined relative to 2022, but still remained above pre-pandemic levels.
- The three remaining indicators did not change from their 2022 levels.
Black and Latinx Americans disproportionately experienced an increase in financial vulnerability.
Figure 3. Percentage-point difference in share of Financially Vulnerable among racial and ethnic groups.
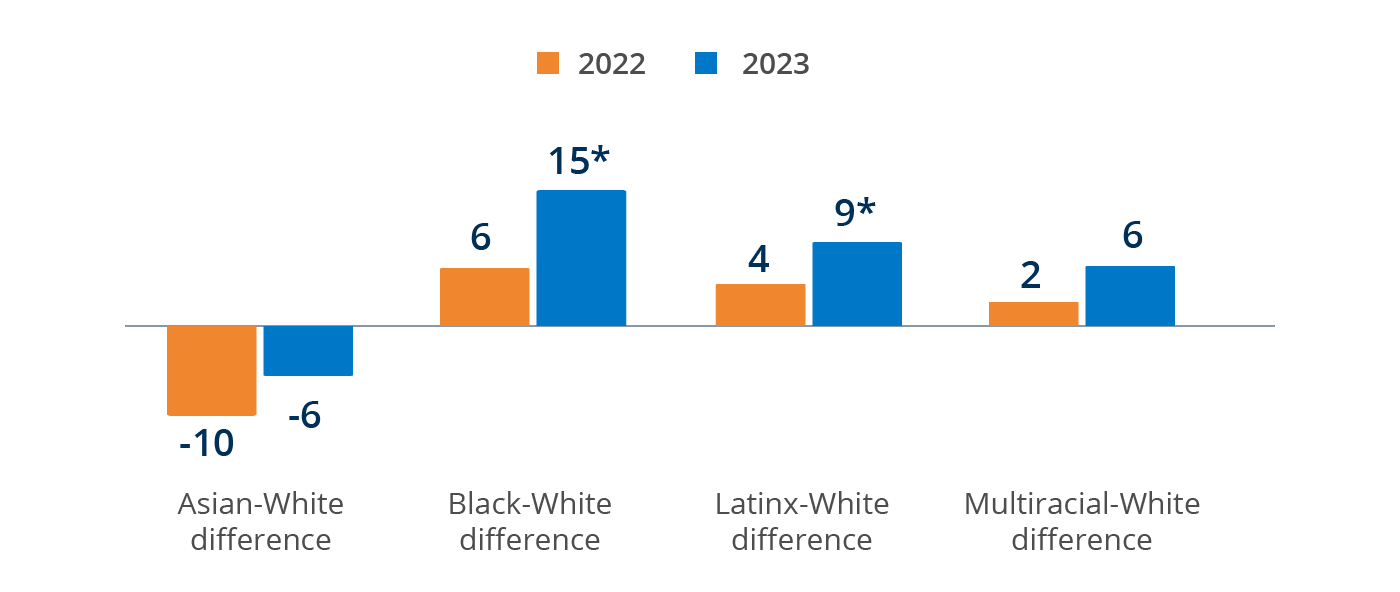
Note: * Statistically significant relative to 2022 (p < 0.05).
-
- Between 2022 and 2023, the share of Black and Latinx Americans who were Financially Vulnerable increased by 6 and 7 percentage points, respectively, while there was no meaningful increase in the share of Financially Vulnerable Asian, White, or Multiracial people.
- Financial health gaps between Black and White Americans and between Latinx and White Americans grew over the past year.
- Black and Latinx Americans experienced growing challenges around borrowing and financial planning.
Younger Americans disproportionately experienced an increase in financial vulnerability.
Figure 4. Percentage-point difference in share of Financially Vulnerable among age groups.
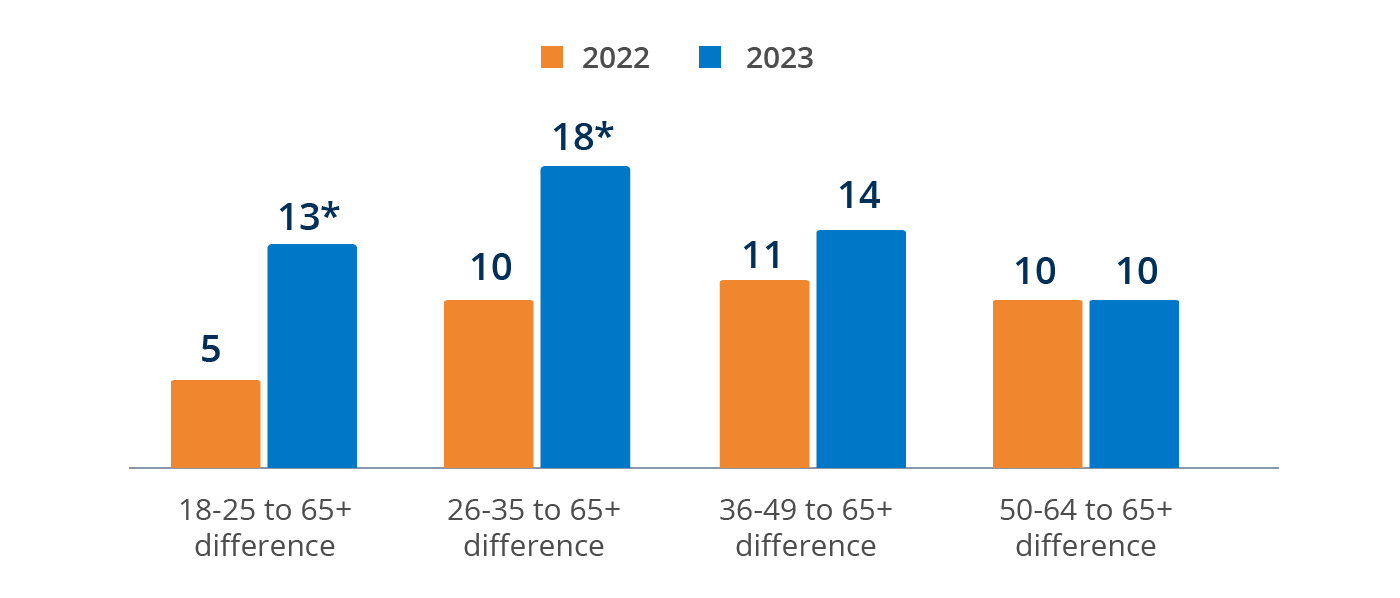
Note: * Statistically significant relative to 2022 (p < 0.05).
-
- Increases in the share of Financially Vulnerable Americans were concentrated among people between the ages of 18 and 35.
- Financial health gaps between the youngest and oldest Americans widened over the past year.
- Americans aged 65 and older face distinct financial challenges around savings, with 44% reporting a lack of confidence in reaching their long-term financial goals and 24% reporting that they did not have enough savings to cover three months of expenses.
Financial Health Pulse® 2023 U.S. Trends Report
Explore the trends. Discover new insights. Build stronger strategies.