Pulse Points: Savings Dwindled as Spending Increased in Q4 2021
Consumers spent more money on recreation and eating out during the 2021 holiday season than during the 2020 holiday season, but many remain vulnerable as government relief programs expire and inflation continues. This brief examines the factors that may shape financial health in the early months of 2022.

Balances Declined More Rapidly During the 2021 Holiday Season
In October 2021, median monthly balances in liquid accounts were higher than in October 2020 – likely the result of reduced spending during the pandemic and accumulated savings due to stimulus payments, child tax credits, and expanded benefits throughout the year. Higher employment rates and stronger wage growth may have also contributed to higher account balances in 2021 than in the previous year.
However, account balances declined more rapidly during the fourth quarter of 2021 than during the same time period in 2020. In Q4 2021, median balances in liquid accounts declined by approximately $1,500 (33%), compared with declines of $750 (20%) in Q4 2020. While holiday spending likely contributed to declining balances in both years, the sharper decline in Q4 2021 may reflect people’s increased comfort or greater ability to spend as the disruptive economic impact of the pandemic subsided in 2021, despite the emergence of the omicron variant. These trends align with declines in the personal savings rate and increased personal consumption expenditures.

Source: Pulse Transactional Dataset (October 1 to December 31, 2020, and October 1 to December 31, 2021). Sample size: 218 individuals. Notes: Line graph shows a $1,500 decrease in savings balances in Q4 2021 and a $750 decrease in savings balances in Q4 2020. Liquid account balances are defined as the daily median of average liquid account balances over the past 30 days. The second round of economic impact payments was administered starting on December 29, 2020, but these payments would not have affected the trends in these graphs because they were disbursed at the very end of the analysis period.
Spending on Recreation and Eating Out Surged in Q4 2021
Spending on eating out and recreation was higher across the entire fourth quarter of 2021 than in the fourth quarter of 2020. In December 2021, average monthly spending on eating out was approximately $72 (33%) higher than spending in the same category in December 2020. Likewise, average monthly spending on recreation was roughly $15 (nearly 60%) higher in Q4 2021 than in Q4 2020. During this time period, inflation increased at the fastest rate in decades, suggesting that the rising costs of goods may have been partially responsible for driving these trends. If high rates of inflation continue in the coming months, balances in liquid accounts may decline further as people draw upon their savings to make ends meet.
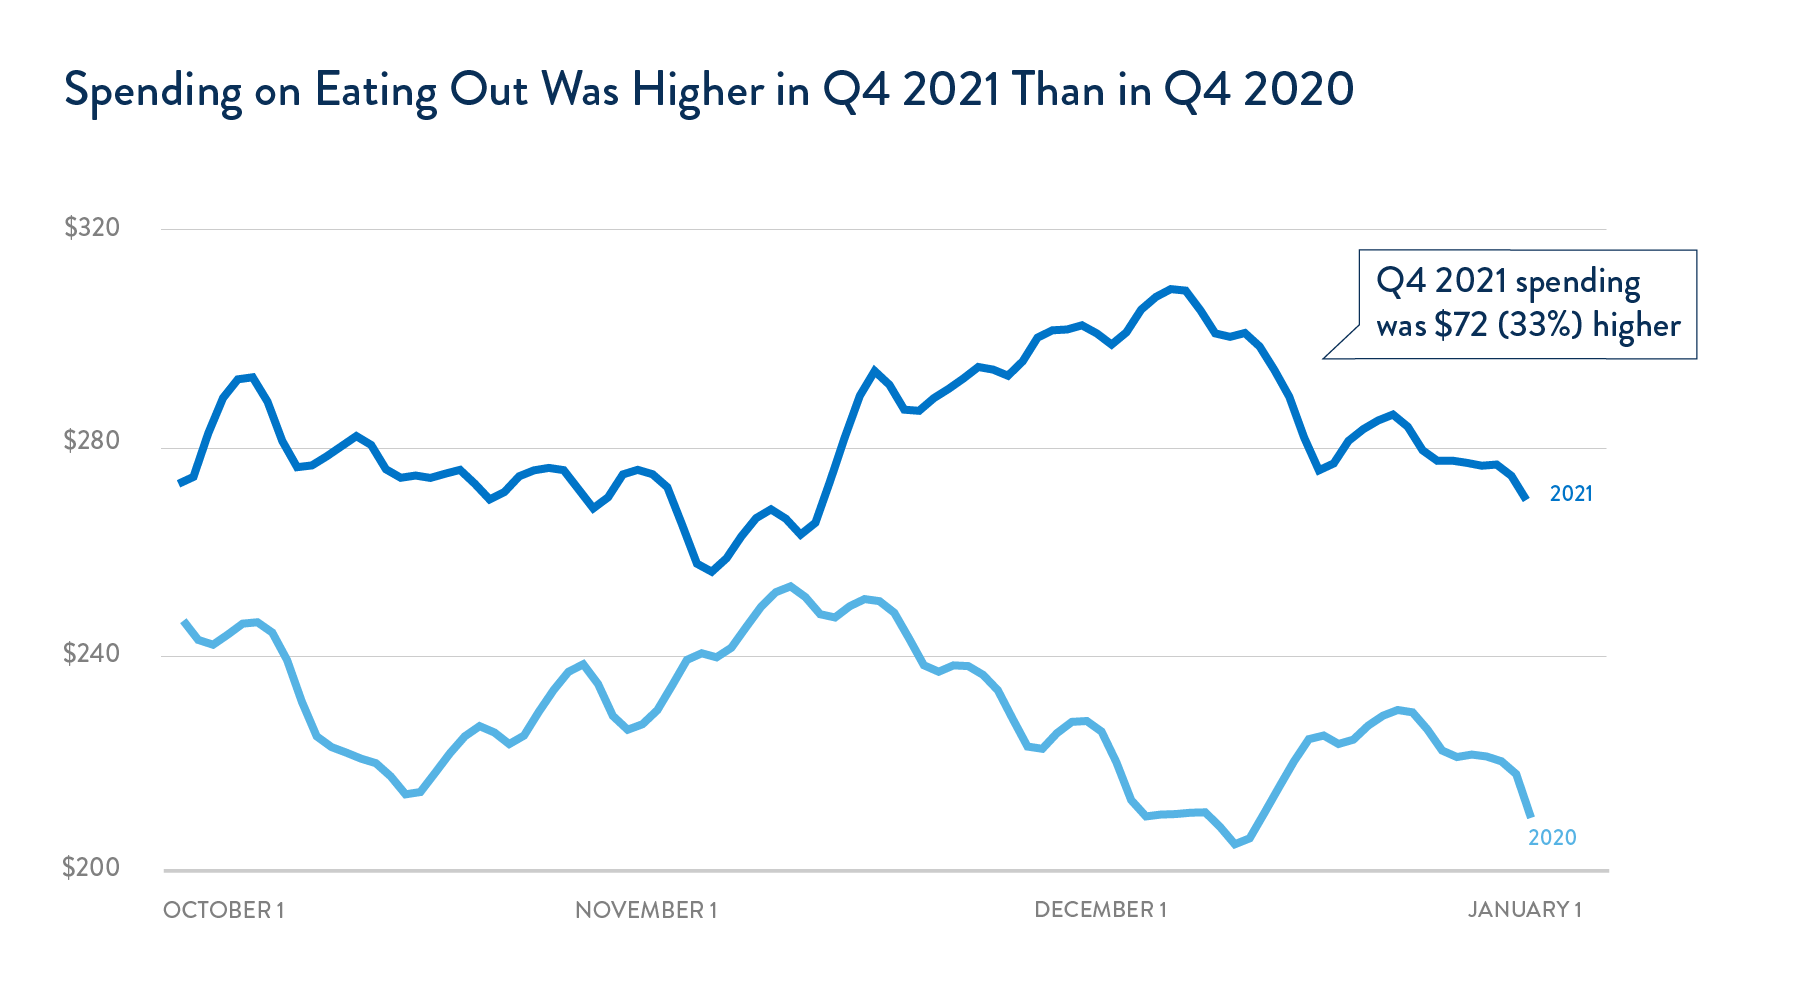
Source: Pulse Transactional Dataset (October 1 to December 31, 2020, and October 1 to December 31, 2021). Sample size: 216 individuals. Notes: Line graph shows that spending on eating out was higher in Q4 2021 than Q4 2020. Spending is defined as the sample mean of total outflows on “eating out,” as categorized by Plaid, from liquid accounts in the past 30 days. Two outliers – a $15,168 transaction in 2020 and a $180,000 transaction in 2021 – were excluded from this analysis.
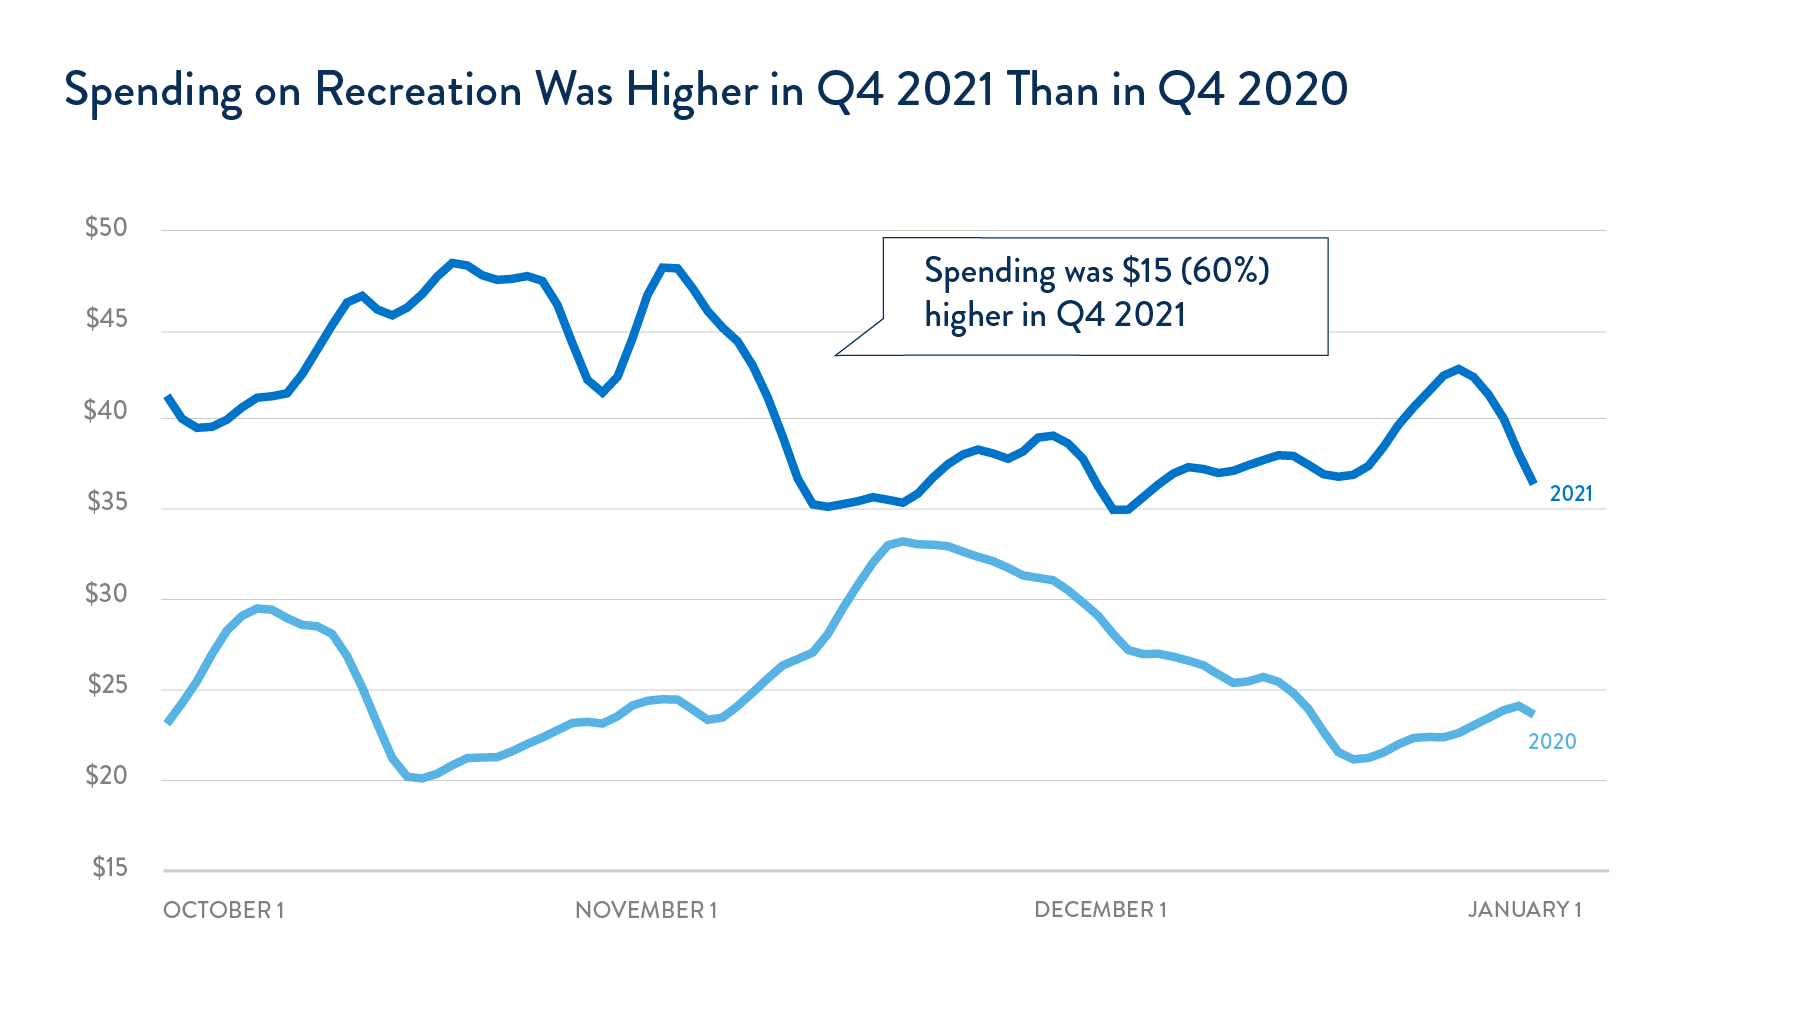
Source: Pulse Transactional Dataset (October 1 to December 31, 2020, and October 1 to December 31, 2021). Sample size: 218 individuals. Notes: Line graph shows that spending on recreation was higher in Q4 2021 than Q4 2020. Spending is defined as the sample mean of total outflows on “recreation,” as categorized by Plaid, from liquid accounts in the past 30 days.
Financially Struggling Consumers Have Become More Vulnerable
People who reported experiencing financial hardship early in the pandemic appeared to end 2021 in a more vulnerable position than the prior year. Among individuals who said they struggled to pay for food, housing, or healthcare in the past 12 months (23% of the sample), median liquid account balances remained relatively constant in 2020. However, in 2021, liquid account balances among this group declined by $986 (40%) over the quarter, though the change was not statistically significant.
While multiple economic factors may have contributed to these trends, the expiration of government benefits likely played an outsized role for this group. Pandemic relief policies – including expanded unemployment insurance, eviction moratoriums, and stimulus payments – largely ended in 2021, forcing many people to draw upon their savings to make ends meet. The ongoing expiration of pandemic relief policies, including the expiration of child tax credits, may further jeopardize the financial health of people who experienced financial hardship and lead to increases in poverty, while ongoing inflation will disproportionately affect people with lower incomes and further strain household balance sheets.

Source: Pulse Transactional Dataset (October 1 to December 31, 2020, and October 1 to December 31, 2021). Sample size: 40 individuals who indicated experiencing hardship. Different types of hardship were observed through four survey questions in the Financial Health Pulse survey (April 2021): 1) “In the past 12 months, I worried whether our food would run out before I got money to buy more.” 2) “In the past 12 months, we had trouble paying our rent or mortgage.” 3) “In the past 12 months, I or someone in my household did not get the healthcare we needed because we couldn’t afford it.” 4) “In the past 12 months, I or someone in my household stopped taking medication or took less than directed due to the costs.” If a response to any of these questions was “often,” “sometimes,” or “rarely,” that person was considered to have experienced financial hardship. Notes: Line graph shows that people who didn’t experience hardship have greater balances than those who experienced hardship. Liquid account balances are defined as the daily median of average liquid account balances over the past 30 days.

Written by
-
 Senior Manager, Data
 -
 Associate, Data
 -
 Manager, ResearchFinancial Health Network
 -
 Senior Director, Research