Pulse Points Fall 2022: Responses to Record-High Gas Prices
As gasoline prices reach all-time peaks, how are Americans adjusting their buying patterns to cope? Analysis of Financial Health Pulse® survey and transactional data suggests that increasing gas costs and consumers’ financial health status may affect how often they refuel and how much they spend per trip to the pump.
-
Program:
-
Category:
-
Tags:
Introduction
The national average price for a gallon of gas increased over 40% from March to July 2022. Economic theory predicts consumers will respond to price increases in at least one straightforward way: As gas prices increase, people will spend less on gas as a function of their preferences and budget constraints. (How drastically they make this adjustment on average is an empirical question.) However, it’s possible that consumers respond to price increases in other ways as well.
Take this clip from the sports talk show “NBA on TNT” as one lighthearted example. In it, one of the hosts, Kenny Smith, says he doesn’t want to buy an inefficient vehicle because it would cost him $80 to fill the tank. His co-host, Shaquille O’Neal, argues that Kenny can avoid spending that much money by not letting the tank get less than three-quarters full.
One charitable interpretation of Shaq’s argument is that he seems to be claiming that purchasing gas four times for $20 feels less bad or is easier to manage than purchasing gas once for $80. Shaq is not the only person known to express this kind of sentiment. An article published in The New York Times in fall 2021, includes an interview with a man at a gas station who “said he had taken to getting smaller amounts of gas twice a week to soften the blow to his bank account.”
These accounts resonated with some of my own experiences as a driver. For example, I remember buying exactly $20 worth of gas at a time in high school. Purchasing smaller amounts of gas per transaction in this way gave me a sense of control over my cash flow.
Taken together, these anecdotes represent far less straightforward responses to price increases than simply cutting back on driving overall or switching to lower-grade gasoline. Do rising gas prices influence people to purchase gas more often? If so, what motivates this behavior?
One explanation could be a cognitive bias like the “pain of paying” that results from loss aversion.1 This could influence people to act as if dollars spent on gas above a certain threshold (say, $20) are more costly than dollars spent below that threshold. Consumers may also engage in a form of “mental accounting,” budgeting a modest amount to spend at the pump on a visit-by-visit basis, regardless of their actual budget constraints or willingness to pay for gasoline.2 It could simply be that some consumers are “anchored” around paying a specific amount to fill up their tanks, and are averse to spending more than what they are used to spending at each visit to the pump.3
It is also possible that consumers will use this type of budgeting strategy if they face liquidity constraints (i.e., the inability to complete a transaction above a certain dollar amount). Those who are not Financially Healthy are more likely to face these challenges, as indicated in their FinHealth Scores® by negative cash flow, difficulty paying bills on time, insufficient short-term savings, and poor credit. If people who are not Financially Healthy respond to price increases by splitting their gas purchases into more frequent, smaller transactions, it could suggest that liquidity constraints play a role in how people manage their gas consumption.
How did Financially Healthy and Unhealthy People Respond to Record-High Gas Prices?
There are two questions we can directly answer with Financial Health Pulse® data to lend some insight:
-
- Did the frequency of gas station transactions increase as prices increased in our sample overall, after accounting for changes in total gas consumption?
- Did Financially Unhealthy people increase their number of gas purchases faster than Financially Healthy people, after accounting for changes in total gas consumption between the two groups?
We answer these questions with the following data:
-
- Participants’ credit card and checking account purchases that occurred at gas stations, which we are able to identify using Financial Health Pulse transactional data.
- The FinHealth Scores of these participants (calculated from their Financial Health Pulse survey responses), which we use to identify participants as either “Financially Healthy” or “Financially Unhealthy.”4
- National average gas retail prices, which are publicly available on a week-by-week basis from the Energy Information Administration.
- Rough estimates of how much gas was purchased per transaction, calculated by dividing dollars spent on that transaction by the average gas price in the nation that week.
Charting Gas Spending Over Time
Total gas consumption in our sample decreased steadily overall as prices rose from February 2021 through July 2022 (Figure 1). The downward trend was similar for both Financially Healthy people and Financially Unhealthy people, and each group’s sensitivity to price over this period was statistically indistinguishable.5 This shows that both Financially Healthy people and Financially Unhealthy people in our sample reduced their gas consumption at similar rates as prices increased.
Figure 1. Gas consumption decreased overall as prices rose.
Daily average of monthly gas purchases (30-day rolling total, in gallons) and 30-day rolling national average retail gas price.
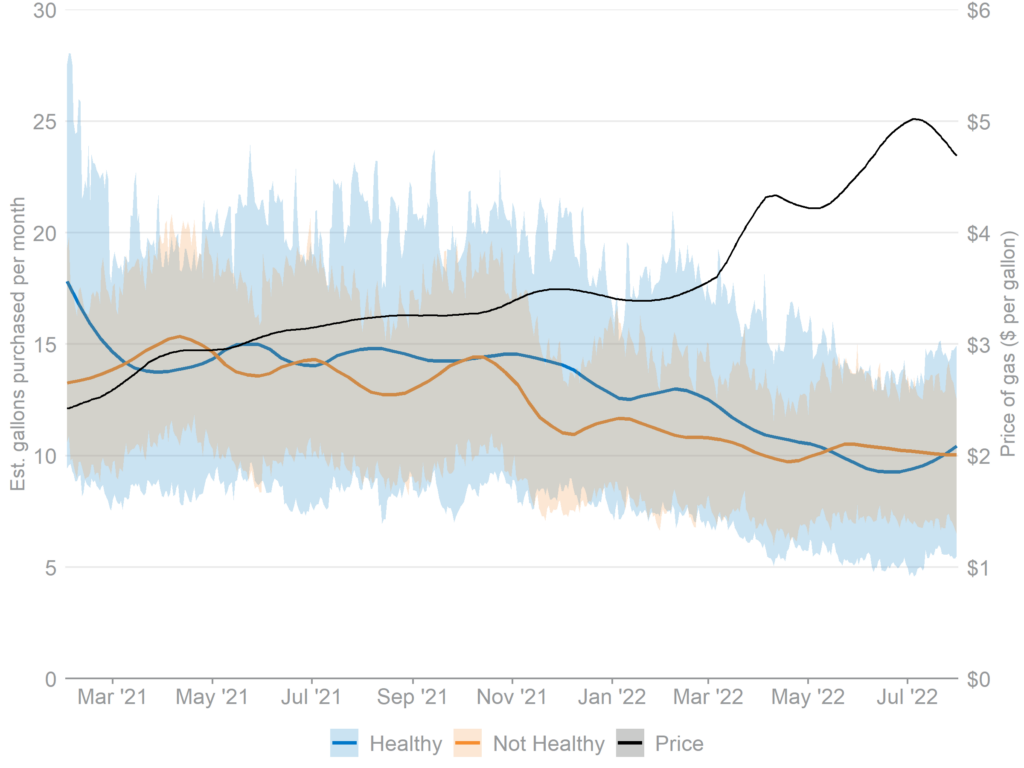
Notes: Shaded areas are 95% confidence intervals plotted around the mean activity estimated on each day. Lines have LOESS smoothing applied as a visual aid. n = 353 people observed on each day (125 Healthy, 228 Not Healthy).
Despite a steady decline in the amount of gas purchased, there were no dramatic changes in frequency of gas station visits in our sample overall (Figure 2). However, each group’s trend in number of trips to the pump per month after March 2022 suggests that when gas prices began their steepest climb, people who are not Financially Healthy may have begun increasing their number of monthly gas refills relative to Financially Healthy people.6
Figure 2. Frequency of gas station purchases by financial health tier may have started to diverge in March 2022.
Daily average of monthly gas station transactions (30-day rolling total) and 30-day rolling national average retail gas price.
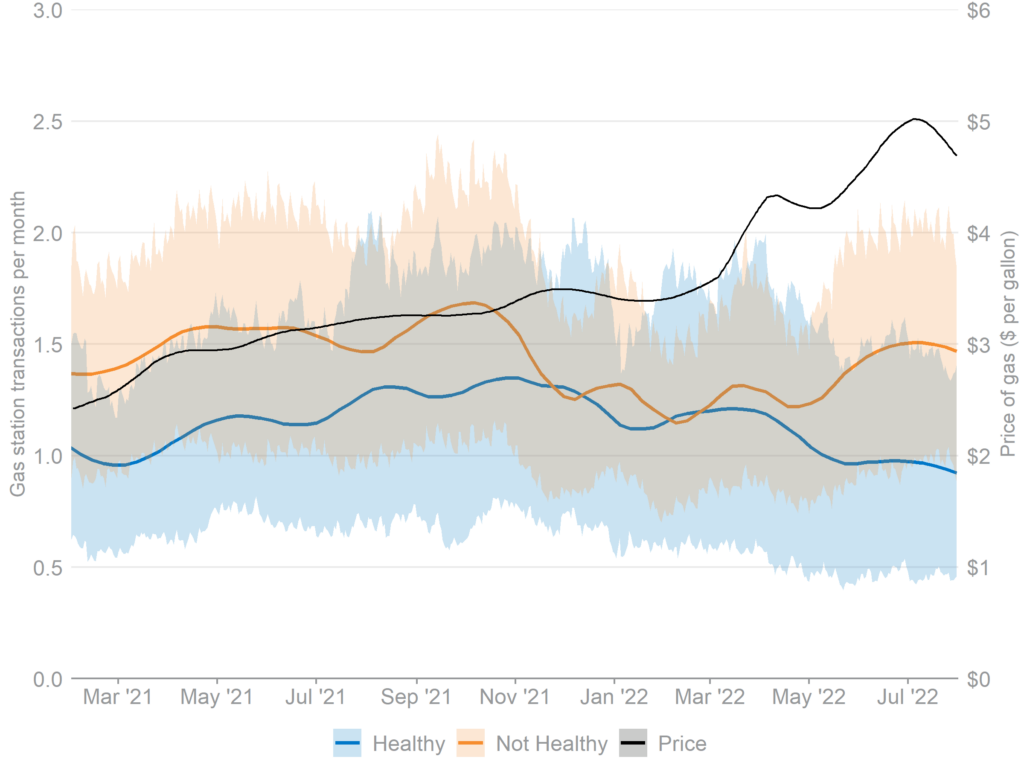
Notes: Shaded areas are 95% confidence intervals plotted around the mean activity estimated on each day. Lines have LOESS smoothing applied as a visual aid. n = 353 people observed on each day (125 Healthy, 228 Not Healthy).
The estimated number of gallons of gas purchased per transaction (i.e., the average transaction size) may have also diverged between Financially Healthy and Unhealthy people. Figure 3 shows that during the period with the steepest price increases (March 1-July 31, 2022), the amount of gas purchased per transaction stayed roughly steady for Financially Healthy people and decreased slightly for Financially Unhealthy people in our sample. This is what we would expect to see if Financially Unhealthy people responded to price increases by purchasing gas in smaller increments. Together, these two visual trends suggest that people who are not Financially Healthy might have responded to increases in the price of gas not only by cutting back on the total amount of gas they purchased per month, but also by increasing the frequency and reducing the size of their purchases.
Figure 3. Financially Unhealthy people purchased smaller amounts of gas per transaction when gas prices were highest.
Daily average of estimated gallons of gas purchased per transaction and 30-day rolling national average retail gas price.
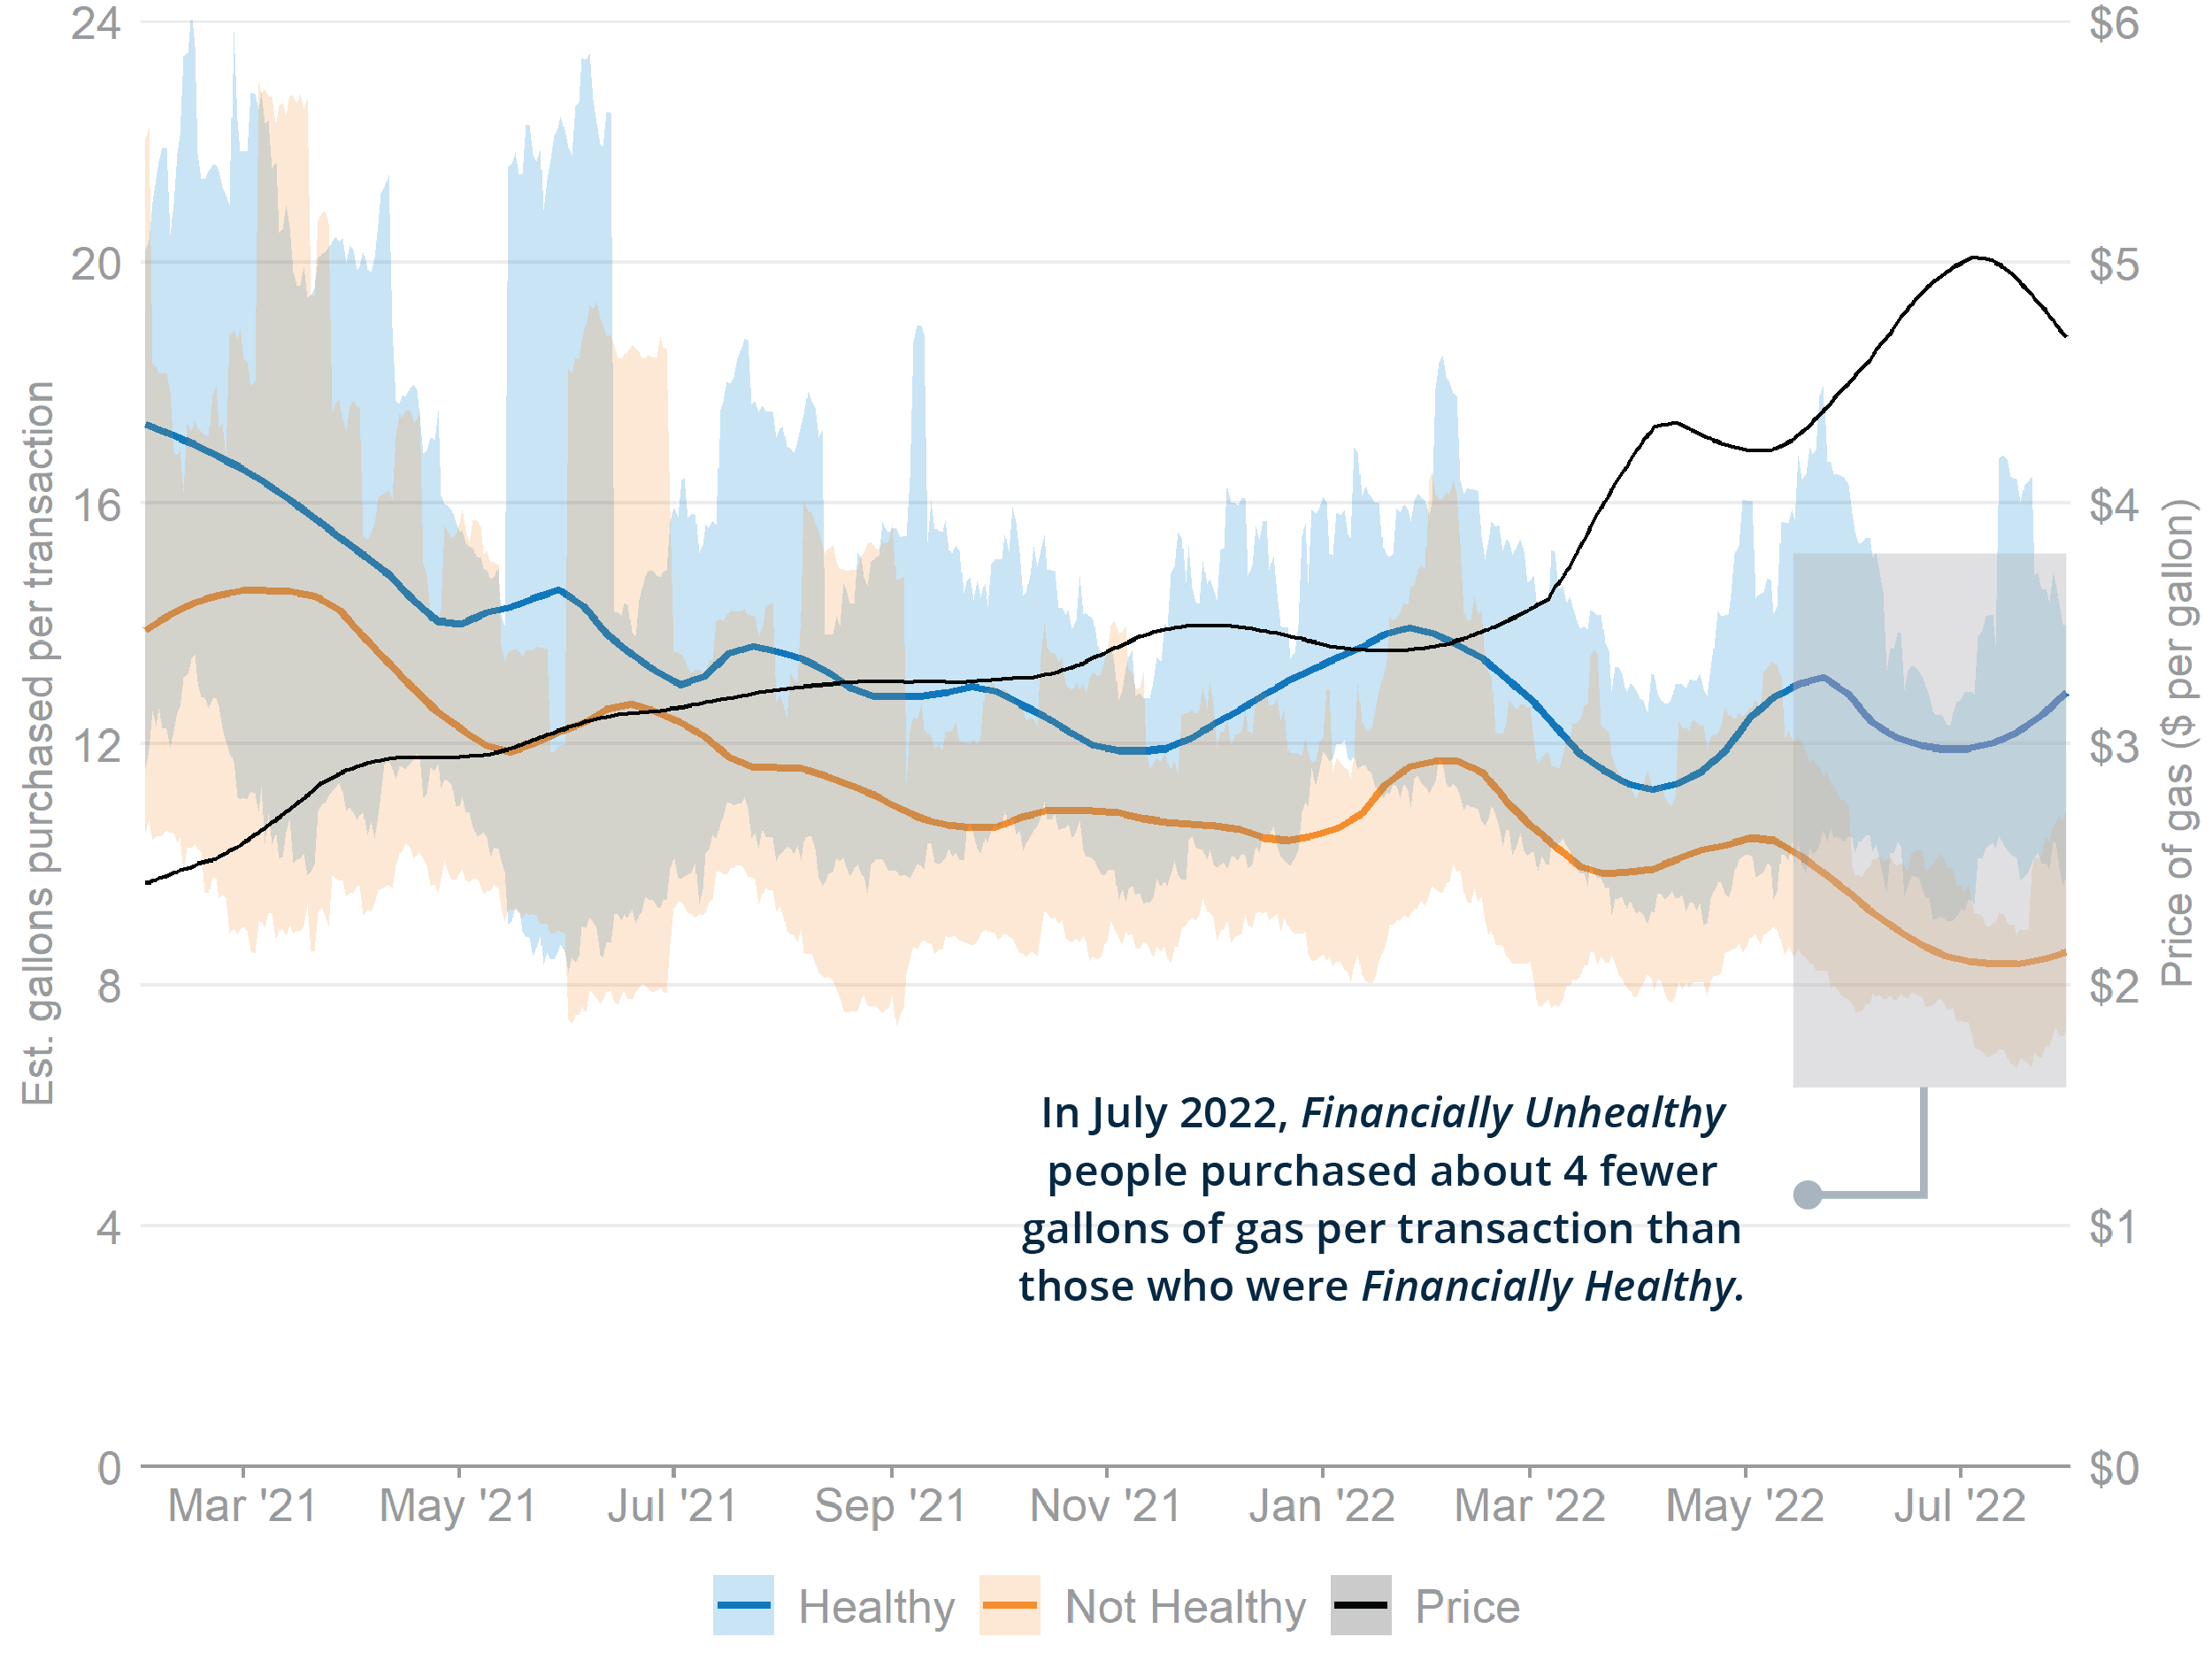
Notes: Shaded areas are 95% confidence intervals plotted around the mean activity estimated on each day. Lines have LOESS smoothing applied as a visual aid. n = 353 people observed on each day (125 Healthy, 228 Not Healthy).
Is Frequency of Refills Related to Price Increases?
Historical trends in the number of trips to the gas station and the amount purchased per trip offer clues to how gas purchases varied for each group over time, but other methods are needed to estimate the relationship between price and consumer behavior directly. Regression analysis allows us to model the relationship between price and transaction frequency for Financially Healthy and Unhealthy people to test whether each group responded to price increases differently at different price points.7
Our results show that each group’s predicted relationship between price and transaction frequency is distinct.8 This is true even after taking into account differences in overall gas consumption between the two groups and seasonal differences in demand for gas. Predictions from our regression model with these controls taken into account are plotted in Figure 4.
Overall, people in our sample increased the frequency of their gas station visits by about 0.18 transactions per month for every $1 price increase. Those who were not Financially Healthy increased their trips to gas stations when gas prices were very high, while those who were Financially Healthy maintained roughly the same number of trips to the pump per month once prices reached $4 per gallon. In other words, Financially Unhealthy people increased the frequency of their gas purchases relative to Financially Healthy people when gas prices were near $5 per gallon, holding total gas consumption constant.
Comparisons of the slopes of each model at different price points confirm that when gas prices were highest (between $4.50 and $5 per gallon), Financially Unhealthy people in our sample were increasing their number of purchases per month at a faster rate than Financially Healthy people (between 0.24 and 0.45 purchases per month faster for each $1.00 increase).9
Figure 4. When gas prices were very high, Financially Unhealthy people increased the frequency of their gas purchases relative to Financially Healthy people.
Estimates of transaction frequency by price, after controlling for total gas consumption and seasonality.
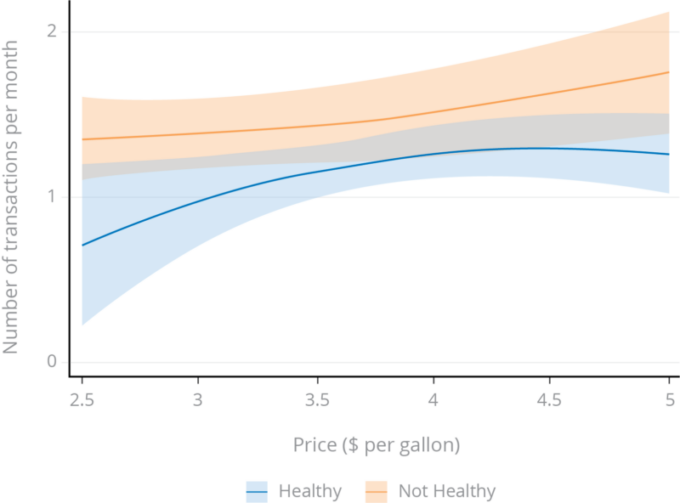
Notes: Plot shows predicted transactions per month for each group, produced by an OLS regression model with a quadratic term for price and controls for gallons purchased per month and monthly indicators to control for seasonality. n = 192,738 person-day observations. Standard errors clustered at the person level (n = 353). Shaded areas are 95% confidence intervals. Though confidence intervals overlap slightly, the estimated number of transactions per month are statistically significantly different at lower price points (~$2.50 to ~$3.25) and higher price points (~$4.50 to ~$5). Contrasts of marginal effects show that the slopes of each line are statistically significantly different between ~$4.50 and ~$5.
Conclusion
Between early 2021 and mid-2022, as gas prices rose, Financially Healthy and Unhealthy people in our sample decreased the amount of gasoline they purchased at similar rates. However, when gas prices were very high and increasing rapidly, people increased the number of times they visited gas stations per month, holding total gas consumption per month constant. This behavior was more pronounced among those who are not Financially Healthy.
We can’t be sure how much of the general population splits gas purchases into more frequent, smaller transactions in response to price increases. Our results should be interpreted with caution because they cover only a very small and unusual window of time, following consumers who are not necessarily representative of the U.S. population as a whole. We also cannot rule out the possibility that the divergence in purchasing behavior is due to some other event unrelated to gas prices that occurred in spring and summer 2022. However, our data offer a hint that Financially Healthy and Unhealthy people may form different purchasing habits in response to very rapid price increases.
Gas prices are just one small component of total consumer spending, but they are a window into how very visible price changes influence spending behavior. Other research has noted that gas prices are closely correlated with overall consumer sentiment, perhaps because of their conspicuousness.10 As Joanne Hsu, Director of the Surveys of Consumers at the University of Michigan, said in a recent article in The New York Times, “There is no other consumer good or service with price tags that are visible from the street, all the time.”11
Our unique data demonstrate just one of the many difficulties Financially Coping and Vulnerable people face meeting day-to-day expenses, as well as how inflation exacerbates those difficulties. The analyses presented here also suggest that Financially Unhealthy people may respond to those difficulties using different budgeting strategies than Financially Healthy people. Previous research has demonstrated that many people with liquidity constraints tightly manage budgets and adjust spending in order to be able to meet day-to-day expenses.12 Smoothing gas consumption over a greater number of transactions may be one of the strategies they use. Future research should explore whether these patterns hold when using larger datasets and different time periods, as well as whether liquidity constraints, specific cognitive biases, or other factors are the most likely drivers of these different responses.
About Our Methodology
This analysis is based on transactional and account data from 353 members of the University of Southern California’s Understanding America Study panel who agreed to share their data through a secure platform that leverages Plaid’s API. These 353 participants represent every panelist who:
-
- Had at least one checking account, prepaid card, or credit card linked to the platform for the entire time period of interest.
- Had responded to a Financial Health Pulse survey between 2020 and 2022. Each respondent’s most-recent available FinHealth Score is used to calculate their financial health tier.
Locally weighted scatterplot smoothing (LOESS) with a 20% smoothing window was applied to generate trend lines in gas purchasing behavior. Please see the complete Financial Health Pulse transactional methodology overview for more information on transactional data collection and analysis.
Gas price data are available from the Energy Information Administration. We apply 30-day rolling averages to the weekly gasoline prices to make them more directly comparable to the 30-day rolling summaries of gasoline purchasing activity we analyze. Because these gasoline prices are national averages, we make the assumption in our analysis that Financially Healthy and Unhealthy people in our sample faced the same price increases on average.
Our ability to definitively answer research questions about gas purchasing behavior is limited by our transactional data in several ways. First, the number of panelists who participate in both surveys and transactional data sharing is limited. Second, because transactional data is collected on an opt-in basis via an online platform, we are only able to capture spending activity from people who have online banking and are willing to share their bank account data with us. These people may have different characteristics on average than the U.S. population as a whole. Further, some financial accounts that are linked to the platform are rarely used, meaning they are not providing us with a complete picture of that participant’s payments.
Finally, we identify gas purchases by identifying which transactions were classified by Plaid as being made at gas stations. We make the assumption that the vast majority of these transactions were retail gasoline purchases, but we cannot know for sure. With this in mind, we removed 21 individuals whose total gas spending in a given month was implausibly large ($900 or more) or implausibly negative ($-752 or less, indicating an unrealistic volume of refunded transactions), reasoning that these could not represent retail gas station transactions made by an individual driver. We also cannot distinguish between different grades of gasoline purchased, so our models cannot distinguish between a person who cuts back on gas spending by buying less gasoline and someone who cuts back by buying cheaper gasoline.
- “Pain of paying,” BehavioralEconomics.com.
- “Mental accounting,” BehavioralEconomics.com.
- “Anchoring (heuristic),” BehavioralEconomics.com
- Because of sample size constraints, we have combined Financially Coping and Vulnerable people together as “Financially Unhealthy” people for this analysis.
- Because of the construction and size of our sample, our data is not well-suited for the task of estimating the price elasticity of demand for gas in the U.S. overall. However, we used a log-log model of monthly consumption on price to produce an estimate of -0.24 (p < 0.1) for our entire sample, which is in the general range of estimates from other literature. Our models estimate a slightly larger elasticity for Financially Unhealthy people, but the difference between the two elasticities is not statistically significant. Therefore, we do not have any evidence that their elasticities of demand for gas differ.
- If the average number of gas transactions per month seems low, keep in mind that a sizable segment of our sample purchases gas only rarely using the accounts they have given us access to, and some who never purchased gas over this entire time period. We have decided to focus our analysis on the overall sample, not just those who purchase gas regularly, to avoid the risk of biasing our data by dropping individuals nonrandomly.
- Linear models without a quadratic term captured significantly different responses to price depending on the date range used for analysis. We report results from quadratic models here because they allow us to model how the relationship between price and transaction frequency (i.e., the slope of the model) could be different at different price points by allowing the model to curve.
- Estimates reported here do not include controls for respondent-level fixed effects. We tested many different specifications of models, with and without fixed effects. Respondent-level fixed effects are not particularly useful in controlling for differences between Financially Healthy and Unhealthy people, because each group is treated as if they were subject to identical price increases (identical treatments).
- The estimated difference between each group’s slope at these price points, holding other covariates at their means, is statistically significantly different from zero. The estimated slopes of each curve at lower price points, while visually distinct, are statistically indistinguishable.
- Carola Binder, “Gas Prices, Inflation Expectations, and Consumer Sentiment,” Mercatus Center at George Mason University, August 2022.
- Emily Badger & Eve Washington, “Why the Price of Gas Has Such Power Over Us, New York Times, October 2022.
- Halpern-Meekin, S., Edin, K., Tach, L., & Sykes, J. (2015). It’s Not Like I’m Poor: How Working Families Make Ends Meet in a Post-Welfare World. University of California Press.
Our Supporters
The Financial Health Pulse is supported by the Citi Foundation, with additional funding from Principal Foundation. Since the inception of the initiative in 2018, the Financial Health Network has collaborated with USC’s Dornsife Center for Economic and Social Research (CESR) to field the study to its online panel, the Understanding America Study. Study participants who agree to share their transactional and account data use Plaid’s data connectivity services to authorize their data for analysis.
The findings, interpretations, and conclusions expressed in this piece are those of the Financial Health Network and do not necessarily represent those of our funders or partners.


