Brief

Overdraft, NSF Fees Bigger Burden Than Previously Estimated

In 2024, consumers spent $12.1 billion on overdraft and NSF fees – approximately 48% more than previously thought.

By Hannah Gdalman, MK Falgout, David Silberman

Monday, March 24, 2025
 Overdraft, NSF Fees Bigger Burden Than Previously Estimated

Beginning with the first quarter of 2024, the National Credit Union Administration (NCUA) began requiring credit unions with over $1 billion in assets to report overdraft and nonsufficient fund (NSF) fee revenue as separate line items in their quarterly filings – the first reporting of its kind for credit unions.1 Recognizing the value of this new publicly available data, the Financial Health Network has analyzed reports for the four quarters of 2024 to gain a more precise understanding of the total overdraft and NSF fees paid by consumers each year. 

With these revised figures, we now estimate that consumers paid $11.8 billion dollars in overdraft and NSF fees in 2023 and $12.1 billion in 2024, compared with our previous 2023 estimate of $7.9 billion. Previous models, which were developed without comprehensive and up-to-date credit union data, understated these costs – and the whole overdraft/NSF picture – by nearly $4 billion. Our updated analysis estimates that consumers paid $5.4 billion in overdraft and NSF fees at credit unions in 2024, up from $5.3 in 2023.

Figure 1. New estimates show that consumers spent $12.1 billion on overdraft and NSF fees in 2024.
Total spending on overdraft/NSF fees at banks and credit unions, in billions.

vertical bar graph showing total spending on overdraft/NSF fees at banks and credit unions, in billions.

Pre-2024 Calculations: How We Historically Estimated Consumer Overdraft and NSF Fees

Since 2015, federal banking agencies have required banks with more than $1 billion in assets to include a line item for overdraft and NSF fee revenue in their quarterly filings. There was no comparable requirement for credit unions. As a result, no public and authoritative data on the overdraft and NSF fees paid by credit union members or by customers of banks with less than $1 billion in assets were available.

To estimate the amount of those fees, researchers and analysts have relied on data collected by the Consumer Financial Protection Bureau (CFPB) in 2015 covering 25% of credit unions and 60% of small banks.2 That data established an initial estimate of overdraft/NSF fees collected by small banks and credit unions, respectively.3 

The Financial Health Network’s annual FinHealth Spend Report has used the CFPB’s 2019 estimate of credit union and small banks’ overdraft/NSF fees as the starting point for estimating fees paid by credit union members each year, as well as to estimate the total amount that all consumers pay in overdraft/NSF fees each year. However, rather than assuming the percentage of overdraft/NSF revenue attributable to these institutions has held constant since 2019 – as the CFPB has done in its subsequent estimates – we assumed that the overdraft/NSF fee revenue of credit unions and small banks followed the same trend as the smallest banks included in the publicly reported data (those with $1 billion to $5 billion in assets).4 Based on this approach, the FinHealth Spend Report 2024 estimated that in 2023, consumers paid $7.9 billion in overdraft/NSF fees, with 82% attributable to overdraft/NSF fees at banks and 18% attributable to overdraft/NSF fees at credit unions.5

Revising Our Estimates: New Data Shifts the Overdraft Toll

Beginning in the first quarter of 2024, the NCUA began requiring credit unions with over $1 billion in assets to include line items for overdraft and NSF fee revenue in their quarterly reports, aligning with the reporting requirements already in place for banks. Each credit union’s data was made publicly available. Notably, the NCUA has since reversed this decision and will no longer publish overdraft revenue data for individual credit unions beginning in 2025.6 Given this change, only one year’s worth of authoritative data for 445 credit unions will be available – providing an important snapshot of the fees charged across the market. While these credit unions represent only around 10% of credit unions nationwide, they collectively account for approximately three-quarters of credit union members and approximately 80% of the assets and deposits held by all credit unions as of the fourth quarter of 2024.7 (In contrast, the data the CFPB had collected in 2015, and on which it based its subsequent estimates, covered only six credit unions with assets above $1 billion.)

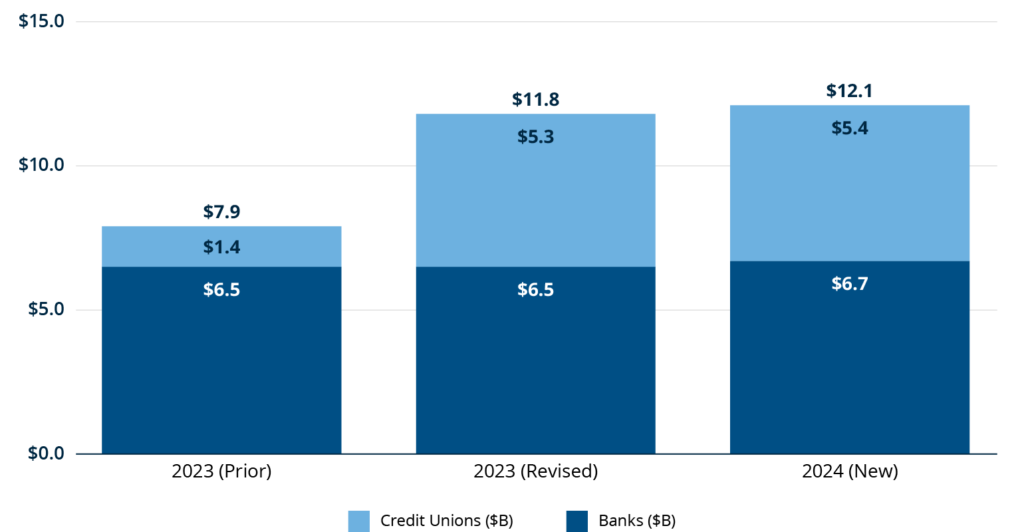
Drawing on these reports, the Financial Health Network has revised its estimate of the amount of overdraft and NSF fees consumers paid in 2023. We also used this data to estimate the amount they paid in 2024.8 As indicated in Figure 1, our prior estimates understated the total amount of overdraft and NSF fees by approximately $3.8 billion. Based on the newly available data, we now estimate the fees paid by credit union members in 2023 reflect 45% of total overdraft and NSF fees, rather than the 18% we previously estimated.9 

The new data implies that the CFPB may have underestimated the share of overdraft and NSF fees attributable to credit unions in 2019. At the same time, the share of overdraft/NSF revenue attributable to credit unions since 2019 has likely increased, since between 2021 and 2023, most large banks either made significant reforms to how they charge overdraft or NSF fees or lowered their overdraft fees. Although some credit unions have taken similar steps – for example, BECU, the nation’s fifth largest credit union, lowered its overdraft fee to $10 in 2022 – credit unions have generally been slower to make changes. For instance, of the banks with over $10 billion in assets, almost two-thirds stopped charging NSF fees by the third quarter of 2023 – including 27 of the top 30 recipients of overdraft/NSF fees in 2021. In contrast, only 4 of the 20 credit unions with assets above $10 billion stopped charging NSF fees between 2021 and the third quarter of 2023.10

The Financial Health Network now estimates that in 2024, consumers of “very large financial institutions,” defined as banks and credit unions with over $10 billion in assets, paid $5.2 billion in overdraft fees. Of that amount, credit union members paid an estimated $735 million, or 14%.11 The overdraft rule the CFPB issued in December would cover these large financial institutions and require them either to lower their overdraft fees or to follow stricter guidelines for their overdraft programs.12

Why Complete Data Matters for Financial Health

The prior underestimation of total credit union overdraft and NSF fees demonstrates the limitations of working with incomplete data. Our previous approach – like the CFPB’s approach – relied on reasonable assumptions and the best available data to avoid overestimating the market. However, this approach also risked understating the full cost and financial impact on consumers. 

The newly available data highlight the ongoing significance of overdraft fees on consumer financial health, reinforcing the need for more comprehensive and granular data to fully capture the costs of financial services on U.S. households. The opportunity for robust public data resonates within the industry, too, with some leaders calling on credit unions to embrace transparency.13, 14, 15 Ensuring that overdraft programs and policies support consumer financial health requires an accurate and comprehensive view of the market.

Methodology

We define overdraft/NSF fees as fees charged for having insufficient funds in one’s checking account to pay for a purchase or charge. This includes an overdraft fee charged if the bank covered the item, or an NSF fee or bounced check fee if the bank returned the item as unpaid. 

Data sources: The revised FinHealth Spend estimates are based on call report data from the Federal Financial Institutions Examination Council (FFIEC) Central Data Repository (2023-2024); National Credit Union Administration (NCUA) Aggregate Financial Performance Reports (FPRs) (2023-2024); and National Credit Union Administration (NCUA) Call Reports (2024, last accessed March 11, 2025).

Our analysis includes overdraft/NSF fee estimates for large banks and large credit unions (assets over $1 billion) and estimates for small banks and small credit unions (less than $1 billion in assets).

    • Analysis of overdraft/NSF at large banks & credit unions: For large banks and credit unions, we use call report data on overdraft/NSF fees from the fourth quarter of 2024. 
    • Analysis of overdraft/NSF at small banks & credit unions: For small banks, we apply the proportion of overdraft fees to noninterest income from banks with assets between $1 and $2 billion to the total noninterest income of small banks. For small credit unions, we similarly estimate overdraft fees by applying the proportion of overdraft fees to total fee income for credit unions with assets between $1 and $2 billion to the total fee income of small credit unions.

To read more about the FinHealth Spend research and methodology, visit https://finhealthnetwork.org/finhealth-spend-research/#methodology.

About the FinHealth Spend Report

The FinHealth Spend Report, previously known as the Financially Underserved Market Size Study, is one of the Financial Health Network’s longest-running research initiatives. The report analyzes household spending on dozens of financial products and services, leveraging extensive secondary research as well as a nationally representative survey on consumer spending. Through this initiative, we gain insight into the impact that interest and fees have on families in the United States and uncover disparities in our system.

We welcome suggestions for additional analysis, partnership, or resources that can strengthen our work. We also welcome inquiries from policymakers, researchers, and others interested in exploring our data in greater detail.


Endnotes
  1. NCUA Chairman Todd M. Harper’s Remarks at the Brookings Institution: Agenda for Credit Union Regulation,National Credit Union Administration, February 2024.
  2. Nicole Kelly and Eva Nagypal, Ph.D., Data Point: Checking Account Overdraft at Financial Institutions Served by Core Processors” Consumer Financial Protection Bureau, December 2021. The CFPB obtained data with respect to 1,266 credit unions of which 80% had less than $100 million in assets and another 18% had less than $500 million in assets; 6 credit unions in the sample had assets over $1 billion. The CFPB also obtained data from 2,372 banks with less than $1 billion in assets.
  3. Using those data and the public reports of larger banks from 2015 to 2019, the CFPB estimated that credit union members paid $2.37 billion in overdraft and NSF fees and customers of small banks paid $1.13 billion in 2019. This accounted for 15% and 7% of total overdraft and NSF fees, respectively.
  4. To estimate overdraft/NSF revenue for years subsequent to 2019, the CFPB assumed that these percentages had held constant. In “Overdraft Lending: Very Large Financial Institutions,” Consumer Financial Protection Bureau, 89 Fed. Register 106768,106825-106826, December, 2024, the CFPB reported that banks with over $1 billion in assets received $7.72 billion in overdraft/NSF fees in 2022, which the agency assumed accounted for 77% of total revenue, consistent with 2019 levels. As the CFPB reported, overdraft and NSF fee revenue for the banks covered by the reported data declined by 23% between 2022 and 2023, implying that consumers paid $7.7 billion in overdraft/NSF fees in 2023.
  5. Hannah Gdalman, MK Falgout, Necati Celik, Ph. D, and Meghan Greene, “FinHealth Spend Report 2024,” Financial Health Network, August 2024.
  6. Hauptman Announces Changes to NCUA’s Overdraft/NSF Fee Collection,” National Credit Union Administration, March 2025.
  7. Quarterly Credit Union Data Summary 2024 Q4,” National Credit Union Administration.
  8. We revised our 2023 estimate of credit union overdraft/NSF fee revenue by applying the proportion of total credit union overdraft and NSF fees to total fee income in 2024 to total credit union fee income in 2023.
  9. This also differs from the CFPB’s prior estimate of 15%. See Note 3.
  10. Vast majority of NSF fees have been eliminated, saving consumers nearly $2 billion annually,” Consumer Financial Protection Bureau, Oct 2023.
  11. This estimate uses the CFPB’s assumption that overdraft fees represent 90.55% of total overdraft/NSF fees.
  12. CFPB Closes Overdraft Loophole to Save Americans Billions in Fees,” Consumer Financial Protection Bureau, December 2024.
  13. Paul Kundert, “Transparency key to healthy credit union movement,” CUInsight, April 2024.
  14. NCUA Board Member Todd M. Harper Statement on the Decision to Curtail the Collection of Overdraft and Non-sufficient Fund Fees,” National Credit Union Administration, March 2025.
  15. NCUA Board Member Tanya F. Otsuka Statement on the Decision to Remove Total Overdraft and Non-sufficient Fund Fee Data,” National Credit Union Administration, March 2025.

Written by

Hannah Gdalman

Manager, Financial Services Solutions
Financial Health Network

MK Falgout

Manager, Financial Services Solutions
Financial Health Network

David Silberman

Senior Advisor
Financial Health Network