FinHealth Spend Report 2021
With this report – an evolution of our Financially Underserved Market Size Study – we shed light on how much households paid for a variety of everyday financial products and services in 2020, through lenses of financial health, income, race, and ethnicity.

Top Takeaway
About two-thirds of the U.S. population struggles to spend, save, borrow, and plan, yet those households contribute 84% of total spending on interest and fees for everyday financial services like credit cards, auto loans, remittances, and overdraft charges, and spend a greater share of their income compared with those who are financially healthy. Financially Coping and Vulnerable households spent a total of $255 billion in 2020, out of a total of $303 billion nationwide. On average, Financially Vulnerable households spent 13% of their income on fees and interest for everyday financial services, compared with 5% for Coping households and just 1% for Financially Healthy households.
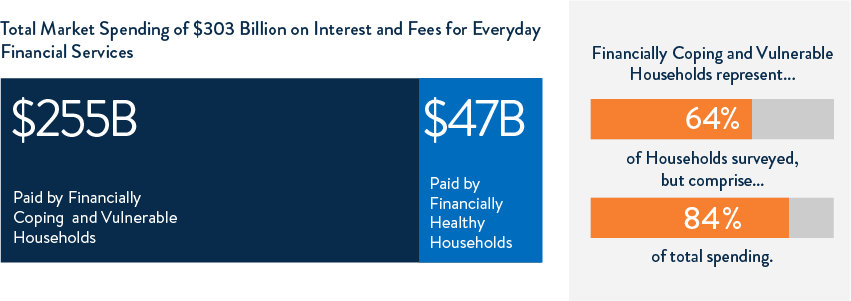
Total market spending of $303 Billion
Research Findings
Through an Equity Lens: Spending by Income, Race, and Ethnicity
In addition to households struggling to manage their financial health, our research analyzed nationwide spending on fees and interest by frames of income, race, and ethnicity, finding that Black, Latinx, and low- to moderate-income (LMI) households all spent a greater share of their income on interest and fees for financial services compared with other groups.
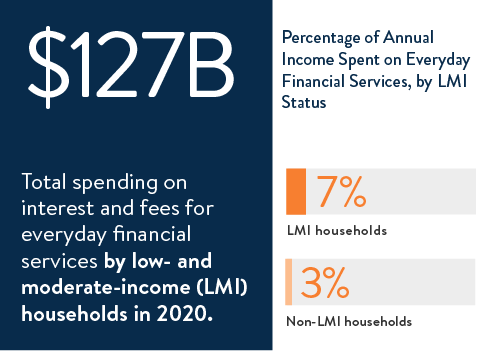 LMI households – those with incomes below 80% of area median income – spent $127 billion total in interest and fees on everyday financial services. On average, each household spent 7% of its annual income on these services, compared with 3% for higher income households.
 Black and Latinx households spent a collective $101 billion on the financial services studied. Black households spent 6% of their annual income on average, Latinx households spent 5%, and White households spent just 3%.
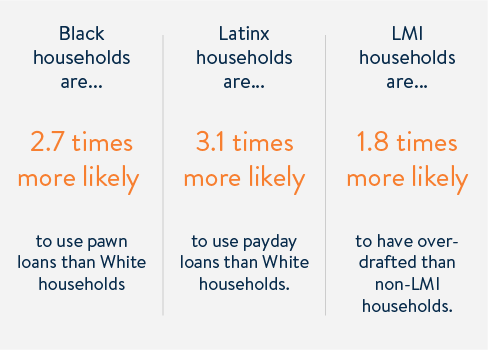
Black and Latinx households, households that are not financially healthy, and those with low-to-moderate incomes are more likely to utilize high-cost, single payment credit products and other alternative financial services, reflective of the economic and racial disparities in access to mainstream services.

2020 data on fees and interest generated by consumers on a wide variety of financial products

Large-scale primary research from a nationally representative survey of consumers on their financial product usage

Views of spending through key lenses including financial health, income, race, and ethnicity

Estimates of auto, renters, and homeowners insurance markets
This report is made possible through the financial support of Prudential Financial.
![]()


FinHealth Spend Report 2021
Explore the trends. Discover new insights. Build stronger strategies.