
With the arrival of a new administration in D.C. in a few weeks, it’s time to refocus on what Americans need now to support their financial health. Our recently released 2020 Trends Report found that many Americans were able to cope during the pandemic largely because of federal interventions and support from financial institutions and other entities. With those sources drying up months ago, millions of Americans are living on borrowed time, with income and expenses failing to add up.
As part of the Financial Health Network’s U.S. Financial Health Pulse®, participants agreed to link their financial accounts to a secure data collection platform, providing us with a unique window into how their financial lives have changed in 2020. The Pulse team conducted an updated analysis with this transactional data through the end of September 2020 to show financial patterns during the pandemic.
This analysis revealed four phases of income and spending – Panic, Calm, Divergence, and Uncertainty – and their disparate effects on financial health for different populations. For the new administration, stabilizing and supporting financial health and resiliency should be a key priority.
Figure 1. Inflows and outflows from liquid accounts revealed four phases of the pandemic: Panic, Calm, Divergence, and Uncertainty.
Daily median of total inflows and outflows in liquid accounts over the past 30 days.
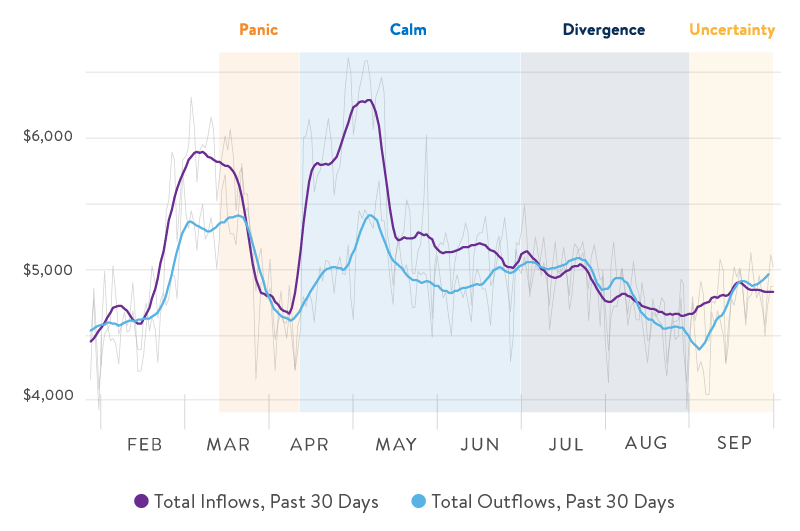
Source: Pulse Transactional Data Set (Jan. 1 – Sep. 30, 2020). Sample size: 431 individuals. Liquid accounts include checking accounts, saving accounts, prepaid cards, money market accounts, and cash management accounts. See the 2020 Trends Report and methodology documentation for more information.
Phase 1: Panic Sets In
Despite a strong economy at the start of the year, late March and early April’s sweeping lockdowns without government relief aligned with changes in spending and incomes. Spending (outflows) were greater than inflows as Americans found their lives changed overnight. These patterns align with data from the Federal Reserve Bank of St. Louis showing that monthly seasonally adjusted American consumer expenditures fell by 19.6% from February to April, telling a story of a nation reeling from the pandemic.
Stage 2: Calm Before the Storm
In April, incomes were buoyed by stimulus checks and tax refunds, which helped to boost consumer confidence and encourage spending. In our analysis, we saw evidence of this increase in inflows from the stimulus payments in April and early May, while median non-stimulus inflows were still depressed from pre-pandemic levels. Non-stimulus inflows had recovered by May, likely because of additional access to higher unemployment payments, some businesses beginning to reopen, and Americans settling into working remotely. Researchers at Columbia University found that 18 million people were spared from falling into poverty as a result of the relief package.
For some higher-income individuals, stimulus payments were a way to boost spending, buy things to make working from home more comfortable, and join campaigns to support local businesses, but the added inflow did not make or break their finances. As part of the Pulse, in early May we asked how valuable individuals had found the stimulus payments. For people with household incomes over $100,000 and those $60,000 to $99,999, 25% and 36% respectively found the income-adjusted payments “very valuable.” Meanwhile, for lower-income earners, the stimulus checks were a way to smooth consumption and pay for bills or necessities in place of previous income. Our research showed that 58% of those with household incomes below $30,000 and 48% of those earning $30,000 to $60,000 found the payments “very valuable.”
Stage 3: The Haves and Have-Nots
As the checks and increased unemployment payments – also generated through the CARES Act – ran out in July, Americans moved into what has become known as a “K-shaped recovery,” in which those with higher incomes started to see their finances recover, while those most deeply affected by the recession struggled. For our participants, liquid savings balances showed that higher-income people were in the best position to bear fluctuations in cash flow. This group was able to adapt spending patterns and use savings to smooth consumption over time. For low-income households, there is little to no room to make changes in spending. We see low-income households with much flatter balances and, therefore, a more acute experience of the highs and lows of this year’s income changes.
Stage 4: An Uncertain Future
This September, we saw mixed messages on economic prospects; with uncertainty high as the election neared, negotiations on further stimulus packages stalled. Additionally, with rolling lockdowns throughout Europe, there’s a risk that we’ll begin to see outcomes falter again across the board. In our data, we found that spending and outflows smoothed out, rather than continuing to rise as expected throughout September. As we speed through the fourth quarter of 2020, which normally leads the year for overall consumer expenditure and discretionary spending, there is a risk that continued uncertainty and lack of support will further increase the disparity in outcomes.
What does this mean for a path forward? We need to prioritize a recovery in spending and to ensure that low-income households have enough to weather the winter. As other income groups recover modestly, low-income people are going without for fear of lack of resources in the future. Policymakers and representatives should focus on activities that stabilize incomes, building confidence that the systemic issues which led to such a disproportionate burden on low-income households will change for the better.
Methodology: To read more about this analysis and the 2020 U.S. Financial Health Pulse Trends Report, visit the Pulse website. Transactional data are collected from study participants who consented to link their financial accounts to a secure online platform that leverages Plaid’s API. These data allow researchers to track key elements of consumers’ financial lives in near-real-time and disaggregate trends by demographics, socioeconomic characteristics, and survey data responses. Liquid accounts analysis includes checking accounts, savings accounts, prepaid cards, money market accounts, and cash management accounts that satisfy the inclusion criteria for this data set (see methodology documentation for more detail). Income analysis leverages self-reported household income data collected in the Q2 Pulse survey.
This post is part of a series from the authors of the U.S. Financial Health Pulse. In the coming months, we plan to discuss different cuts of the data and respond to compelling questions and feedback we receive from our audience.
The U.S. Financial Health Pulse is made possible through a founding partnership with Flourish, a venture of The Omidyar Group. Additional support is provided by MetLife Foundation, founding sponsor of the Financial Health Network’s financial health work, and AARP. The Financial Health Network is partnering with the University of Southern California Dornsife Center for Economic and Social Research to field the survey to their online panel, the Understanding America Study. Study participants who agree to share their transactional and account data use Plaid’s data connectivity services to authorize their data for analysis.