Financial Health Pulse® 2024 U.S. Trends Report


Indicators of day-to-day financial health decreased, while forward-looking indicators increased.

Households with outstanding credit card debt increasingly struggled with day-to-day financial health indicators.

Households with investments experienced increased levels of confidence in their financial futures.

Middle-income households experienced an increase in financial vulnerability.
Indicators of immediate financial concerns weakened.
Table 1. 2023-2024 trends in day-to-day financial health indicators
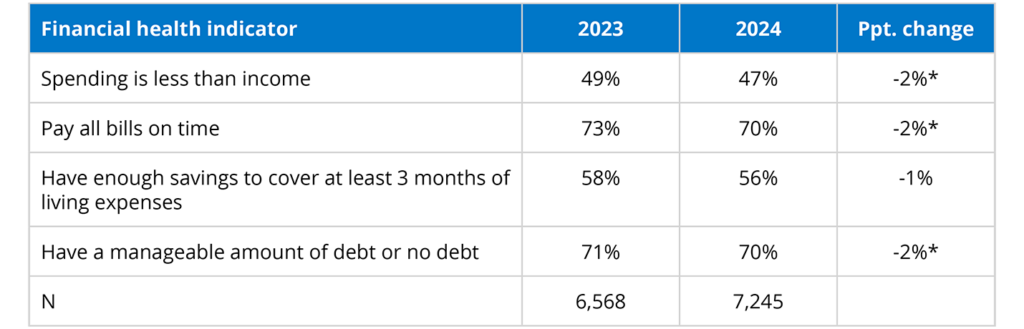
Notes: Percentage point changes may not exactly match differences in percentages due to rounding.
* Statistically significant at p < .05.
-
- The share who reported spending less than their income decreased from 49% to 47%.
- Two more indicators decreased from 2023 to 2024: on-time bill payment and debt manageability.
- The change in the proportion of households who had three or more months of liquid savings was not statistically significant. However, the percentage reporting less than one week in savings did increase.
More households reported confidence in their long-term goals, and more households reported planning ahead.
Table 2. 2023-2024 trends in forward-looking financial health indicators
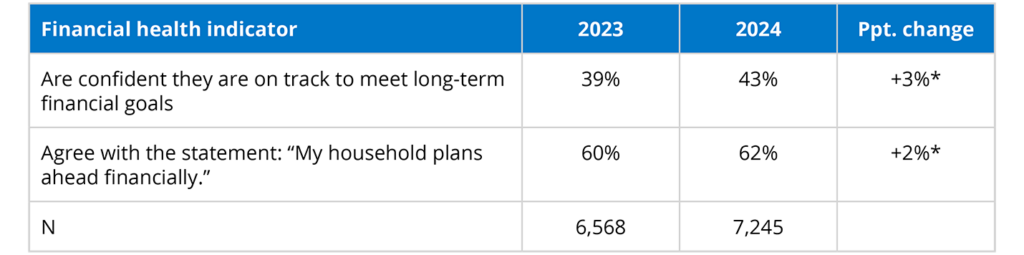
Notes: Percentage point changes may not exactly match differences in percentages due to rounding.
* Statistically significant at p < .05.
-
- The number of American households that felt confident they were on track to meet long-term financial goals increased by 3 percentage points from 2023 to 2024.
- Nearly two-thirds of American households (62%) agreed they were planning ahead financially, up from 60% a year ago.
Households with credit card debt reported struggling more frequently with immediate financial concerns in 2024 than 2023.
Table 3. 2023-2024 trends in day-to-day financial health indicators, by credit card debt ownership
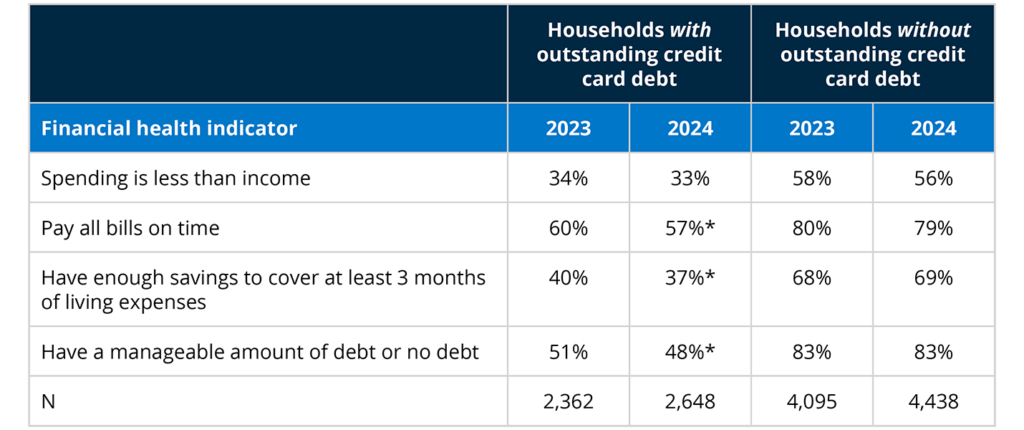
Notes: In 2023, 108 respondents reported not knowing whether their household had outstanding credit card debt and three skipped the question. In 2024, 152 respondents reported not knowing whether their household had outstanding credit card debt and seven skipped the question.
* Statistically significant relative to 2023 at p < .05.
-
- Between 2023 and 2024, the percentage of households with credit card debt that were paying all their bills on time, had at least three months of living expenses saved, or had a manageable amount of debt all decreased.
- For households without credit card debt, day-to-day indicators remained steady, while confidence in long-term goals increased.
Households with investments saw increases in forward-looking indicators
Table 4. 2023-2024 trends in forward-looking financial health indicators, by investment ownership
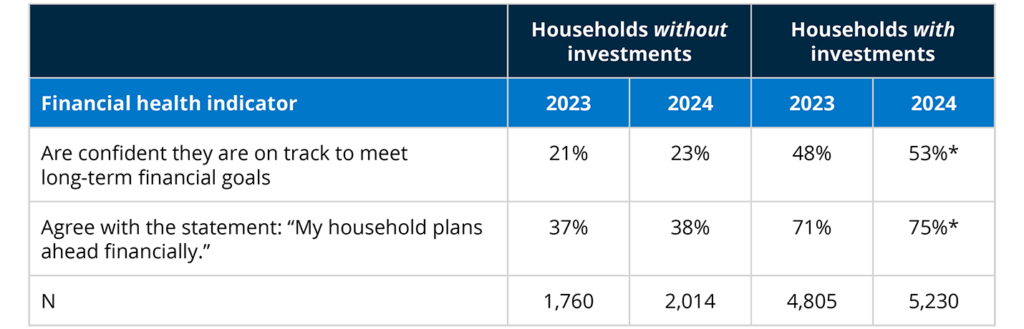
Notes: A household is classified as having investments if they report having at least one of the following: employer-provided retirement account, individual retirement account, or a non-retirement investment account. One respondent in 2024 and three respondents in 2023 had a missing investor status.
* Statistically significant relative to 2023 at p < 0.05.
-
- The share of households with investments who were confident they were on track to meet long-term financial goals increased from 48% to 53%.
- The share who reported planning ahead financially increased from 71% to 75%.
- Forward-looking indicators did not increase for households without investments.
A sharp decrease in debt manageability contributed to an increase in financial vulnerability.
Figure 1. Percentage in each financial health tier, by household income and year
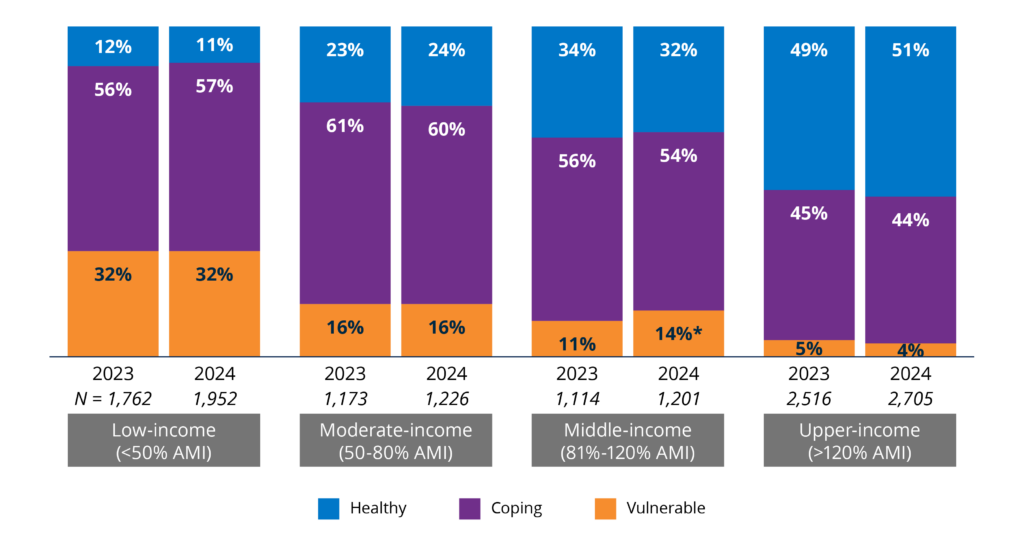
Notes: AMI is defined as the median household income for that respondent’s Metropolitan Statistical Area (MSA), or county if the respondent does not live in an MSA. In 2023, there were three respondents with missing income or geographic information needed to calculate AMI, and in 2024, there were 161 respondents with missing information. Percentage points may not sum to 100% due to rounding.
* Statistically significant relative to 2023 at p < .05
-
- Between 2023 and 2024, the proportion of middle-income households that were Financially Vulnerable rose from 11% to 14%.
- Middle-income households increasingly struggled to manage their debt, which may be related to the fact that this income group most frequently holds revolving credit card debt.1, 2
- Other day-to-day financial health indicators decreased for middle-income households as well, including spending less than income, paying bills on time, and short-term savings.
Acknowledgments
The Financial Health Network is grateful to the members of the Financial Health Pulse Advisory Council for their thoughtful reviews and strategic guidance.
The Financial Health Network is collaborating with USC’s Dornsife Center for Economic and Social Research to field the study to its online panel, the Understanding America Study. We thank them for their partnership.
The Financial Health Pulse is supported by the Principal Foundation. The findings, interpretations, and conclusions expressed in this piece are those of the Financial Health Network and do not necessarily represent those of our funders or partners.
![]()
Financial Health Pulse® 2024 U.S. Trends Report
Explore the trends. Discover new insights. Build stronger strategies.