Inflows and Outflows

January – March 2021

Largely driven by stimulus payments and tax refunds, median inflows to liquid accounts increased in January and March. Shortly following the arrival of stimulus payments, median outflows increased as well. People considered Financially Vulnerable or Financially Coping and those with lower incomes experienced the largest relative increases in account inflows.

Understanding the Data

These graphs display trends from the Pulse transactional dataset over the past quarter. Place your cursor over a trend line to view the date, category, median value, 95% confidence interval, and sample size for the given data. Given sample sizes and confidence intervals, these data should be viewed as directional and illustrative in nature. See the measurement notes below for additional information.

Total Sample

Financial Health

Household Income

Gender

Race and Ethnicity

Measurement Notes

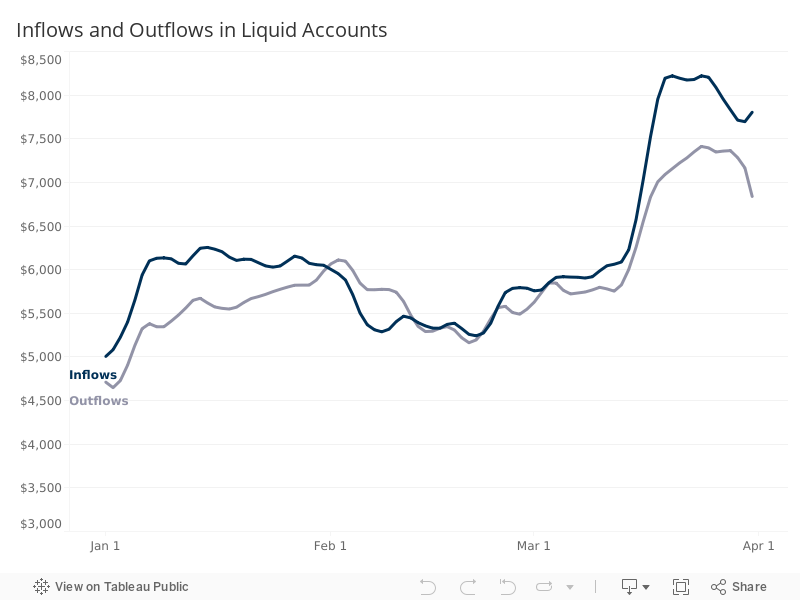
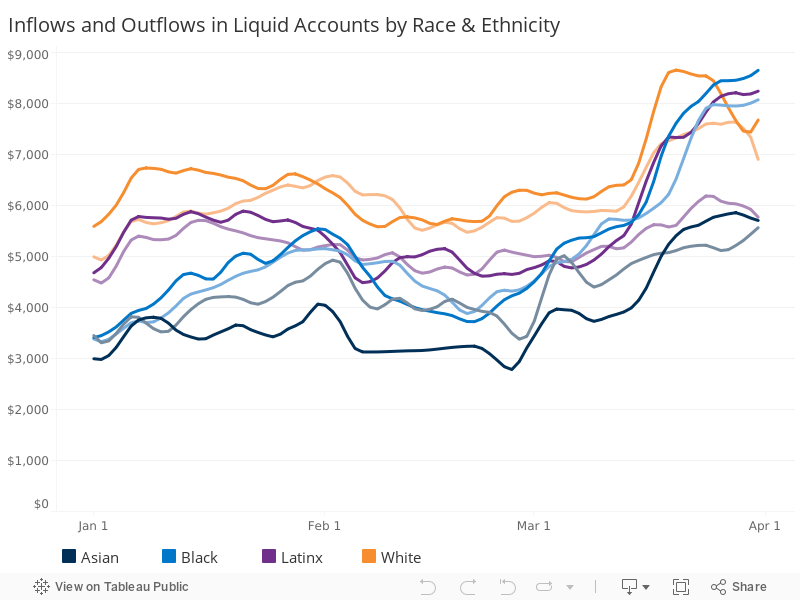
Inflows and outflows from liquid accounts are calculated using totals over a past 30-day rolling period for each day, starting with Jan. 1, 2021. The median of the sample is calculated on each day and lowess smoothing is applied with a 10% smoothing window to generate the trend lines shown in the chart. Liquid accounts include checking accounts, savings accounts, prepaid cards, money market accounts, and cash management accounts that satisfy the inclusion criteria for this dataset. Demographic variables (i.e. household income, race/ethnicity, gender, and financial health tier) are determined using data from Pulse surveys. The demographic composition of the sample broadly aligns with the online banked population of the United States. See complete methodology overview>>

Explore More Pulse Transactional Data

Account Balances

Liquid account balances trended upward in late March as a greater share of stimulus payments were held in liquid accounts.

Credit Card Balances

These graphs display trends from the Pulse transactional dataset over the past quarter.