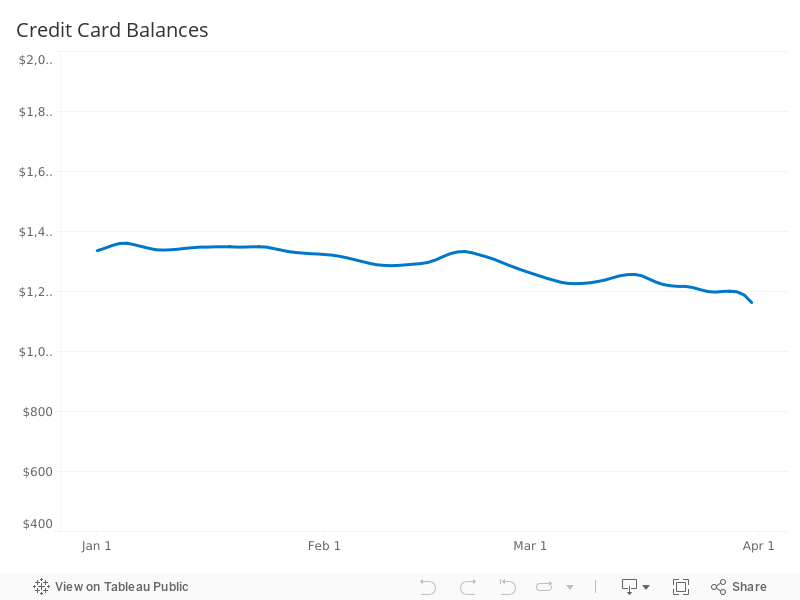
Account Balances
Liquid account balances trended upward in late March as a greater share of stimulus payments were held in liquid accounts.
January – March 2021
There were no statistically significant changes in credit card balances through the first quarter of 2021, aligning with data from the Federal Reserve showing that the total amount of consumer loans, including credit cards, has stayed relatively constant over the past quarter.
These graphs display trends from the Pulse transactional dataset over the past quarter. Place your cursor over a trend line to view the date, category, median value, 95% confidence interval, and sample size for the given data. Given sample sizes and confidence intervals, these data should be viewed as directional and illustrative in nature. See the measurement notes below for additional information.
Credit card balances are calculated as the average balance over a past 30-day rolling period for each day, starting with Jan. 1, 2021. The median of the sample is calculated on each day and lowess smoothing is applied with a 10% smoothing window to derive the trend lines shown in the chart. Only the credit card accounts that satisfy the inclusion criteria for this dataset are included in this sample. Demographic variables (i.e. household income, race/ethnicity, gender, and financial health tier) are determined using data from Pulse surveys. The demographic composition of the sample broadly aligns with the online banked population of the United States. See complete methodology overview>>
Liquid account balances trended upward in late March as a greater share of stimulus payments were held in liquid accounts.
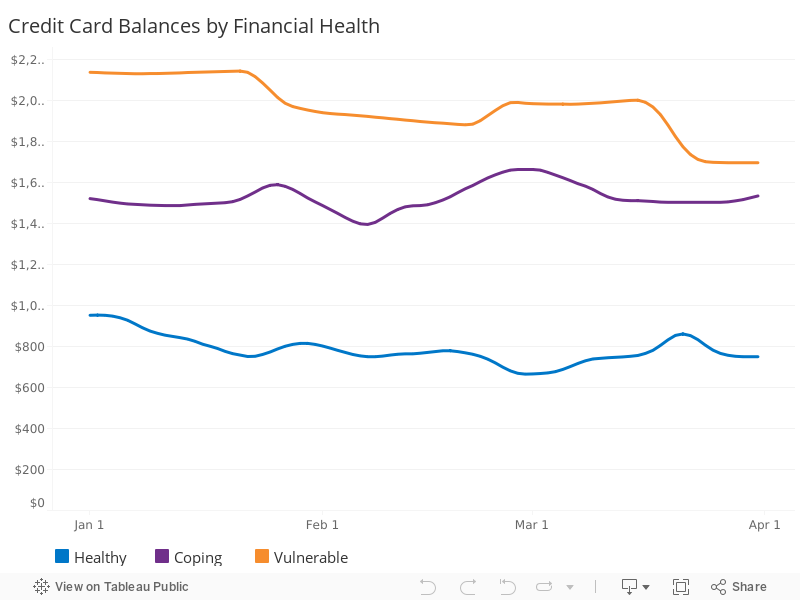
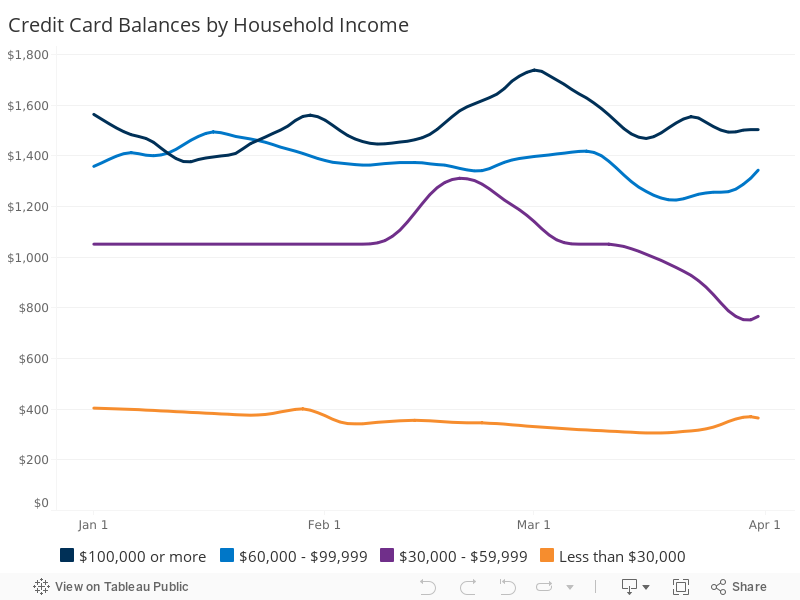
Largely driven by stimulus payments and tax refunds, median inflows to liquid accounts increased in January and March. Shortly following the arrival of stimulus payments, median outflows increased as well. People considered Financially Vulnerable or Financially Coping and those with lower incomes experienced the largest relative increases in account inflows.